Software Screenshot:
Software Details:
Version: 2.0
Upload Date: 27 May 15
Developer: Dan Maguire
Distribution Type: Freeware
Downloads: 42
Size: 609 Kb
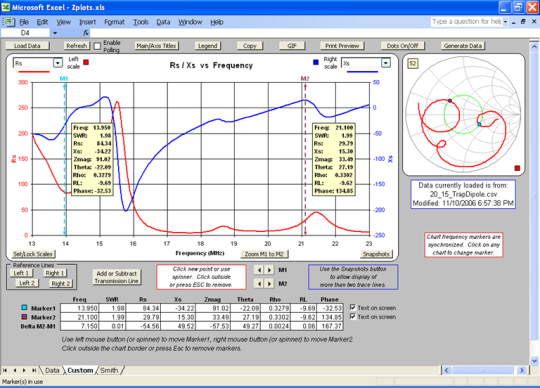
Zplots is an Excel application that allows you to plot impedance and related data obtained from a variety of sources. You can plot on both an XY chart and a Smith chart as well as view the data in tabular format. The XY chart can be customized with your choice of trace lines. Frequency (in MHz) is always shown on the X axis.
What is new in this release:
Version 2.0 added to measure "Measure Transmission Line Parameters" and plot various items related to transmission lines.
Requirements:
MS Excel 97 or later


Comments not found