Software Screenshot:
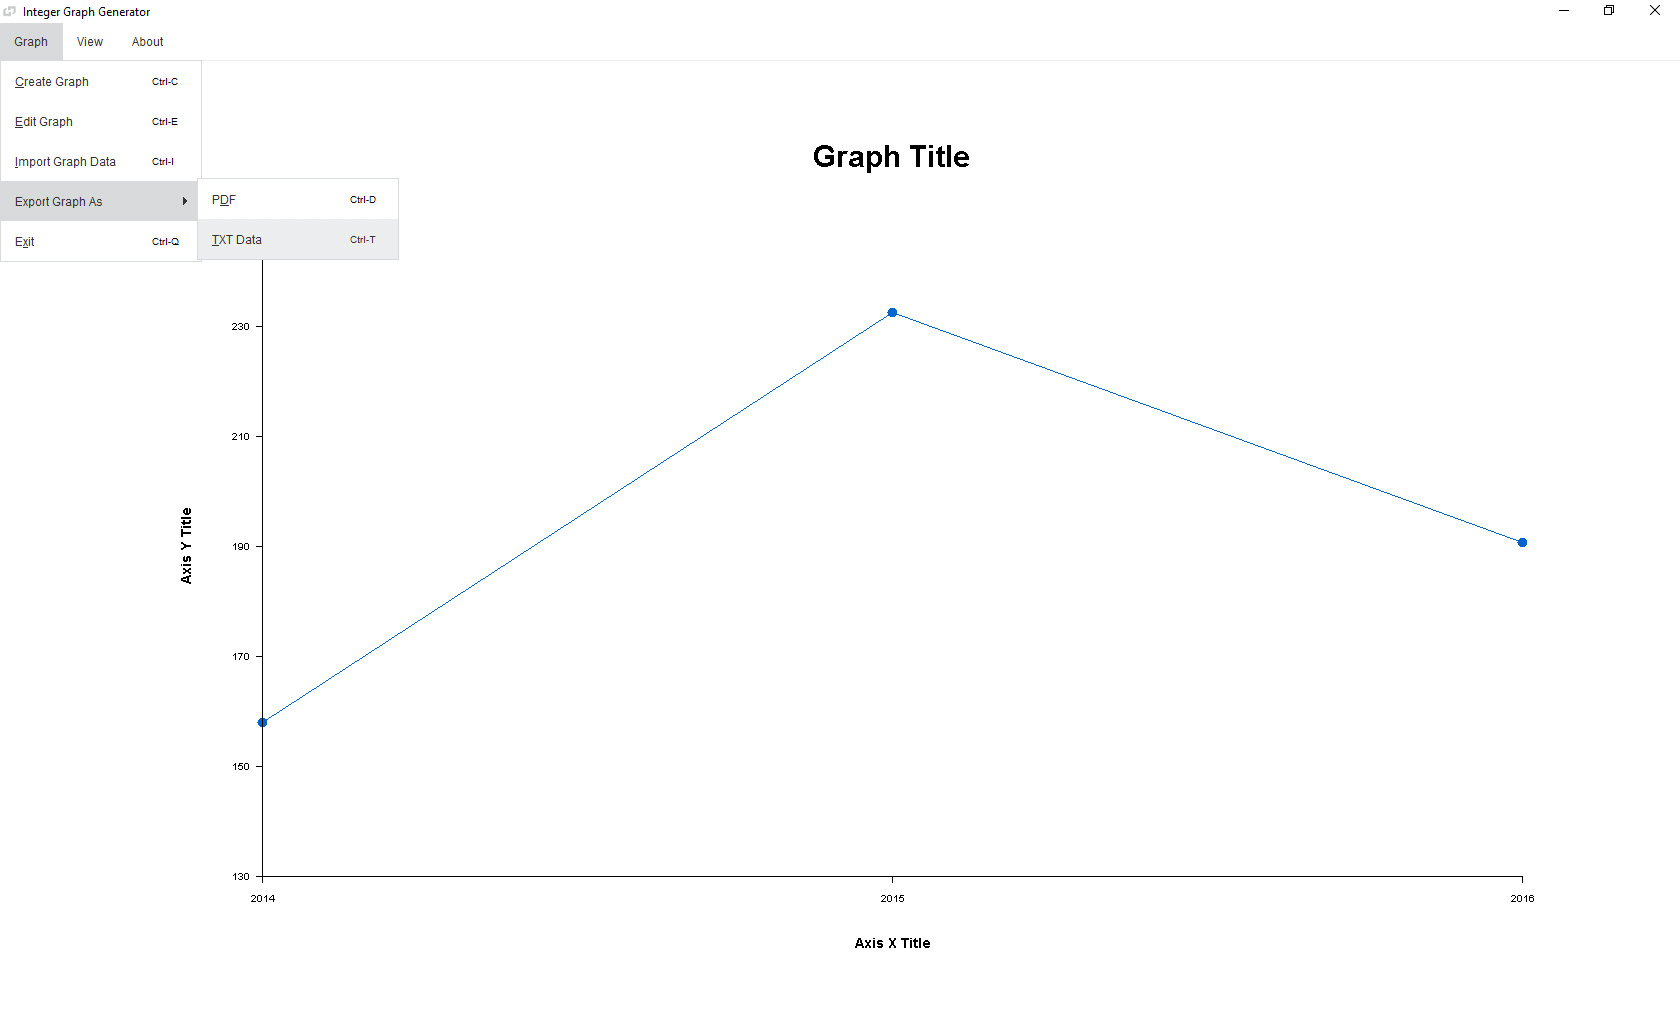
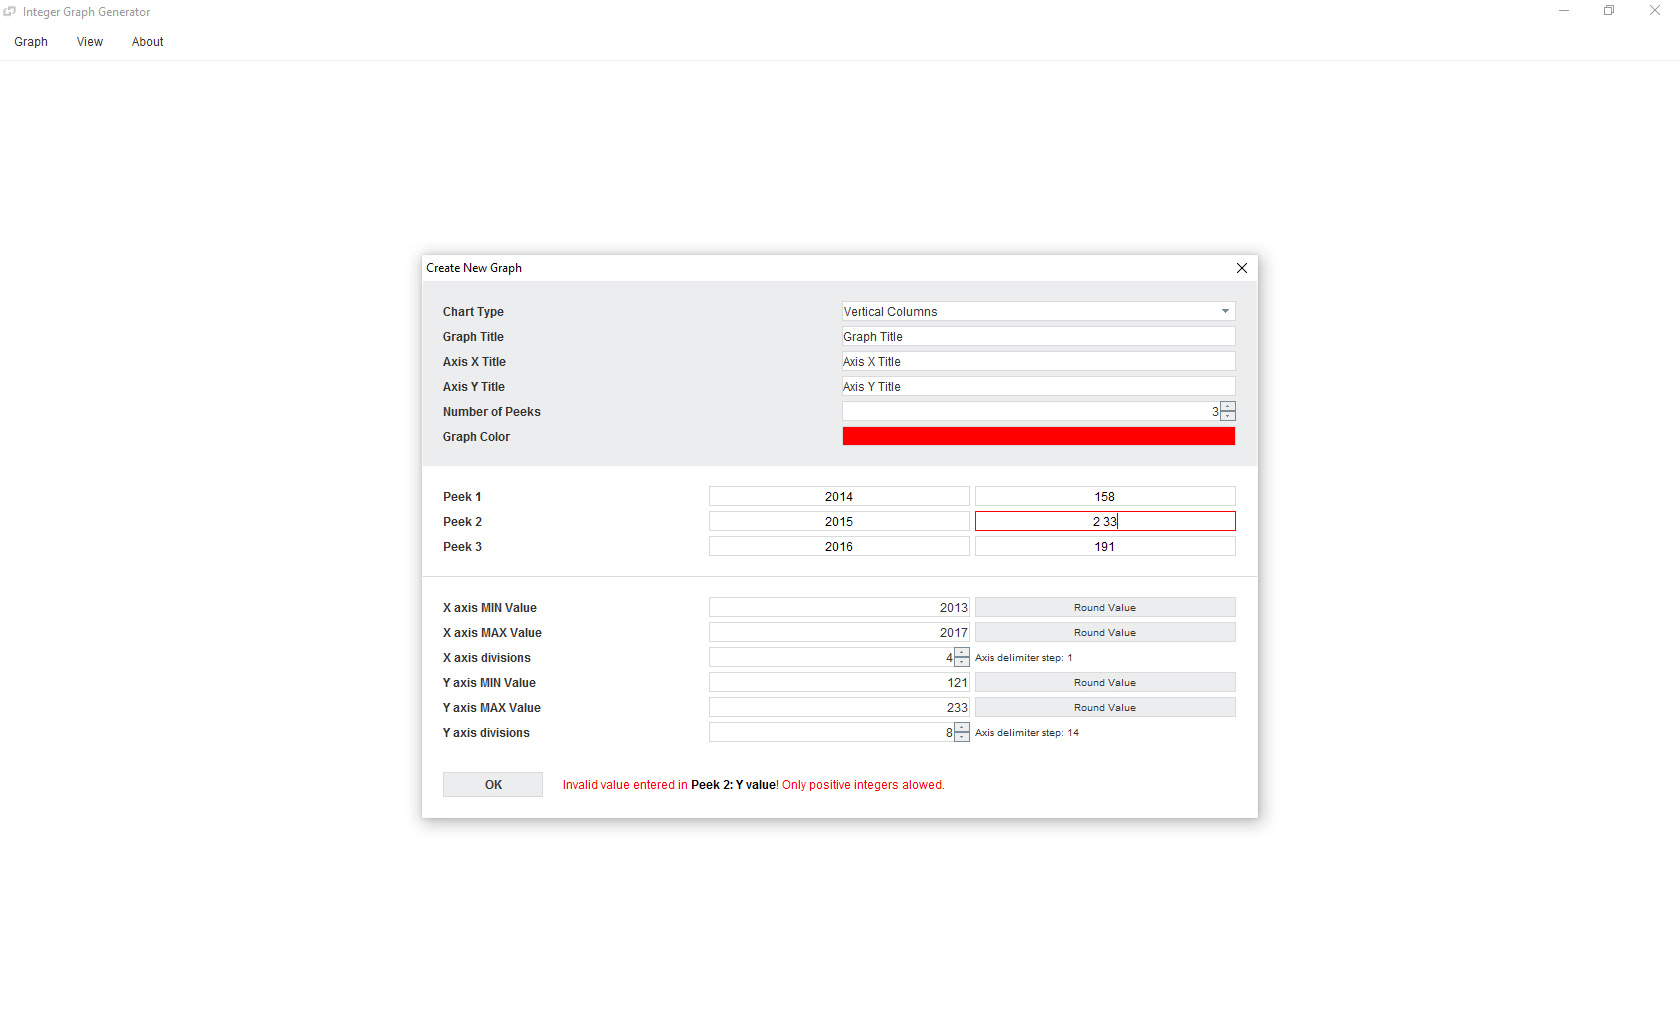
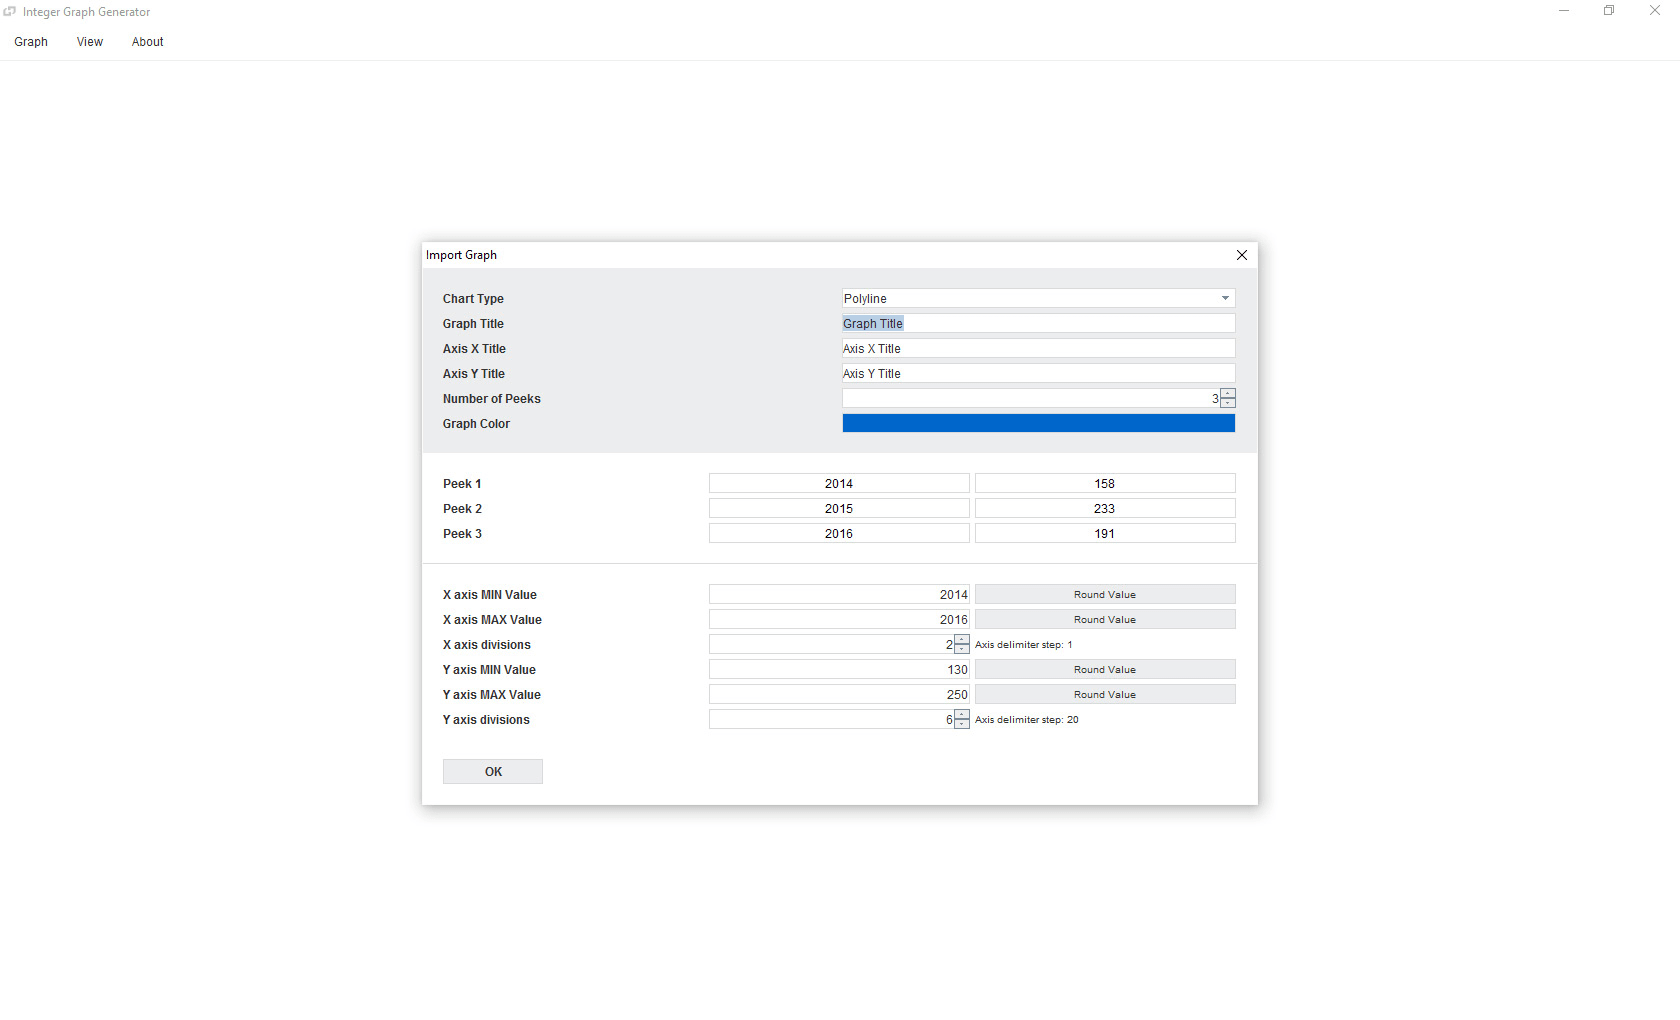
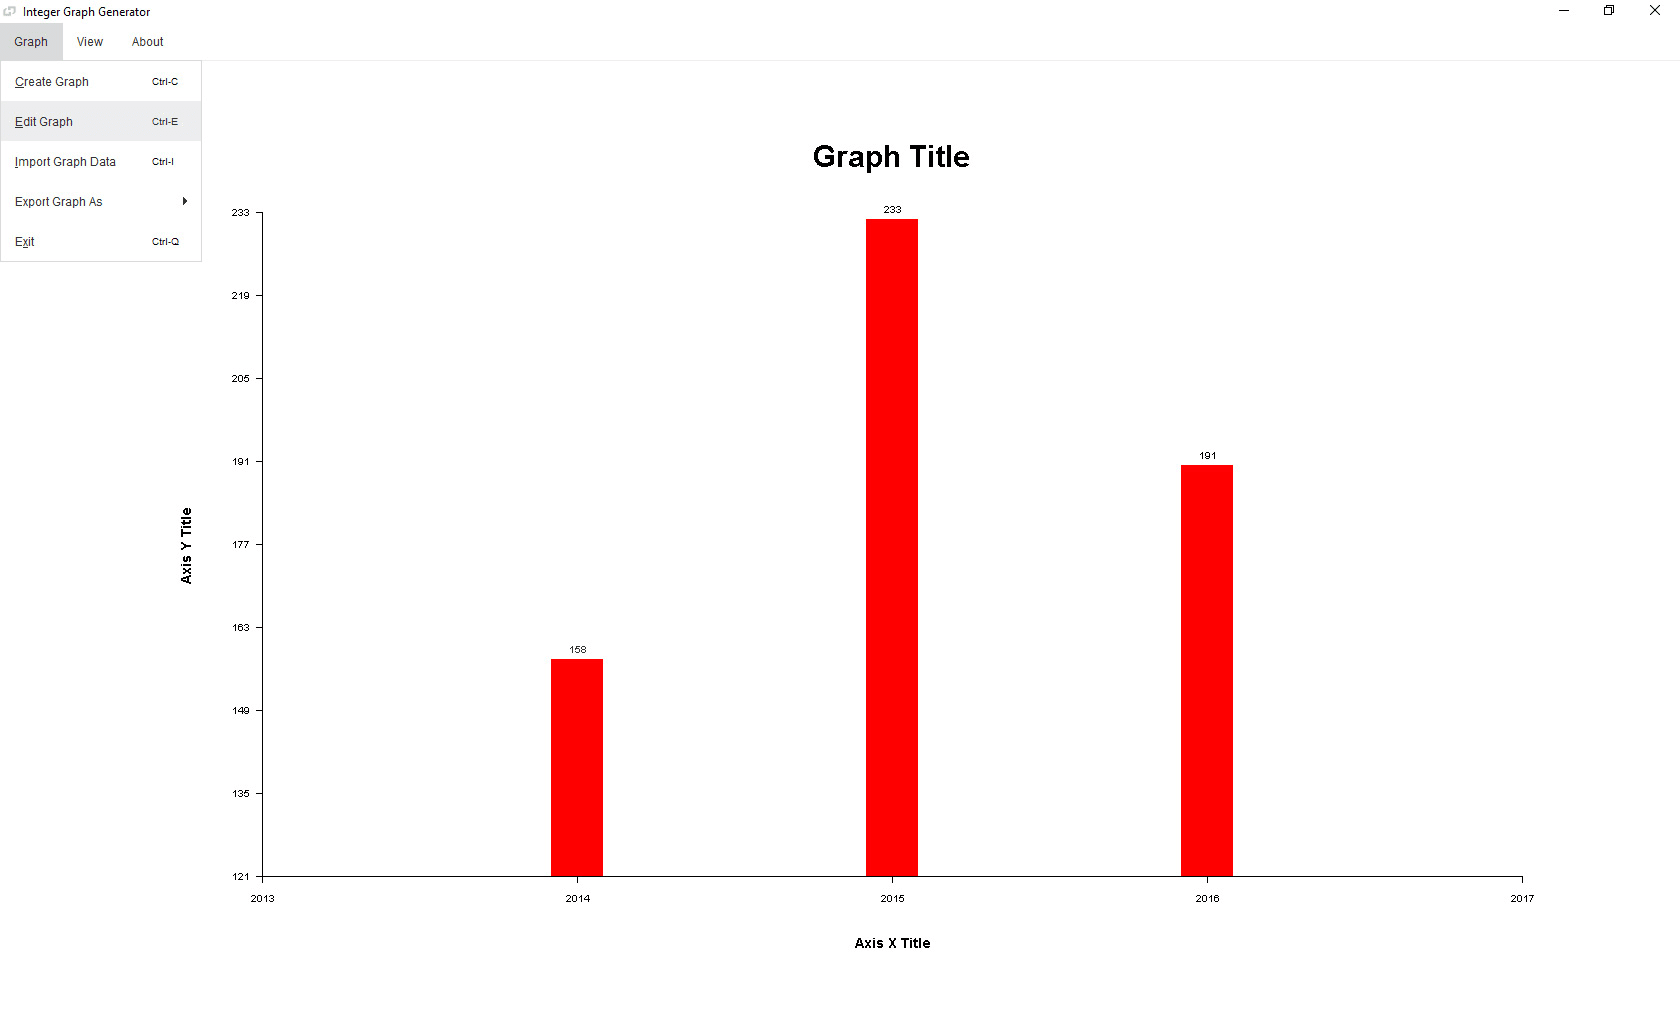
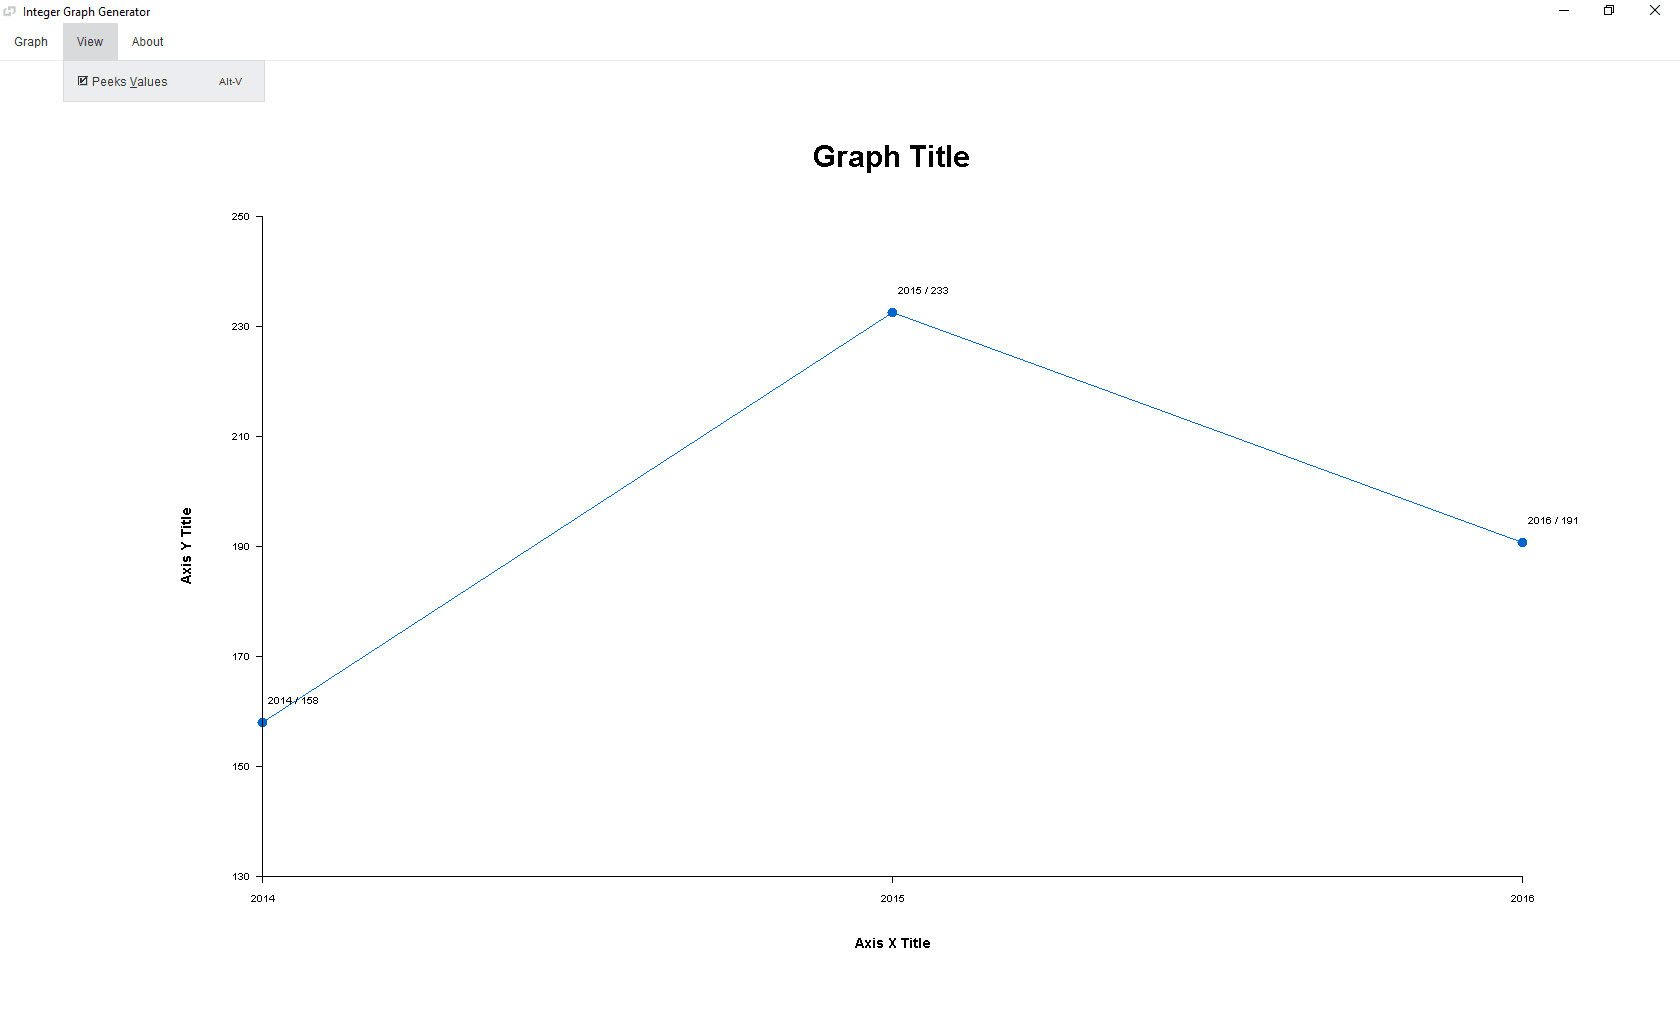
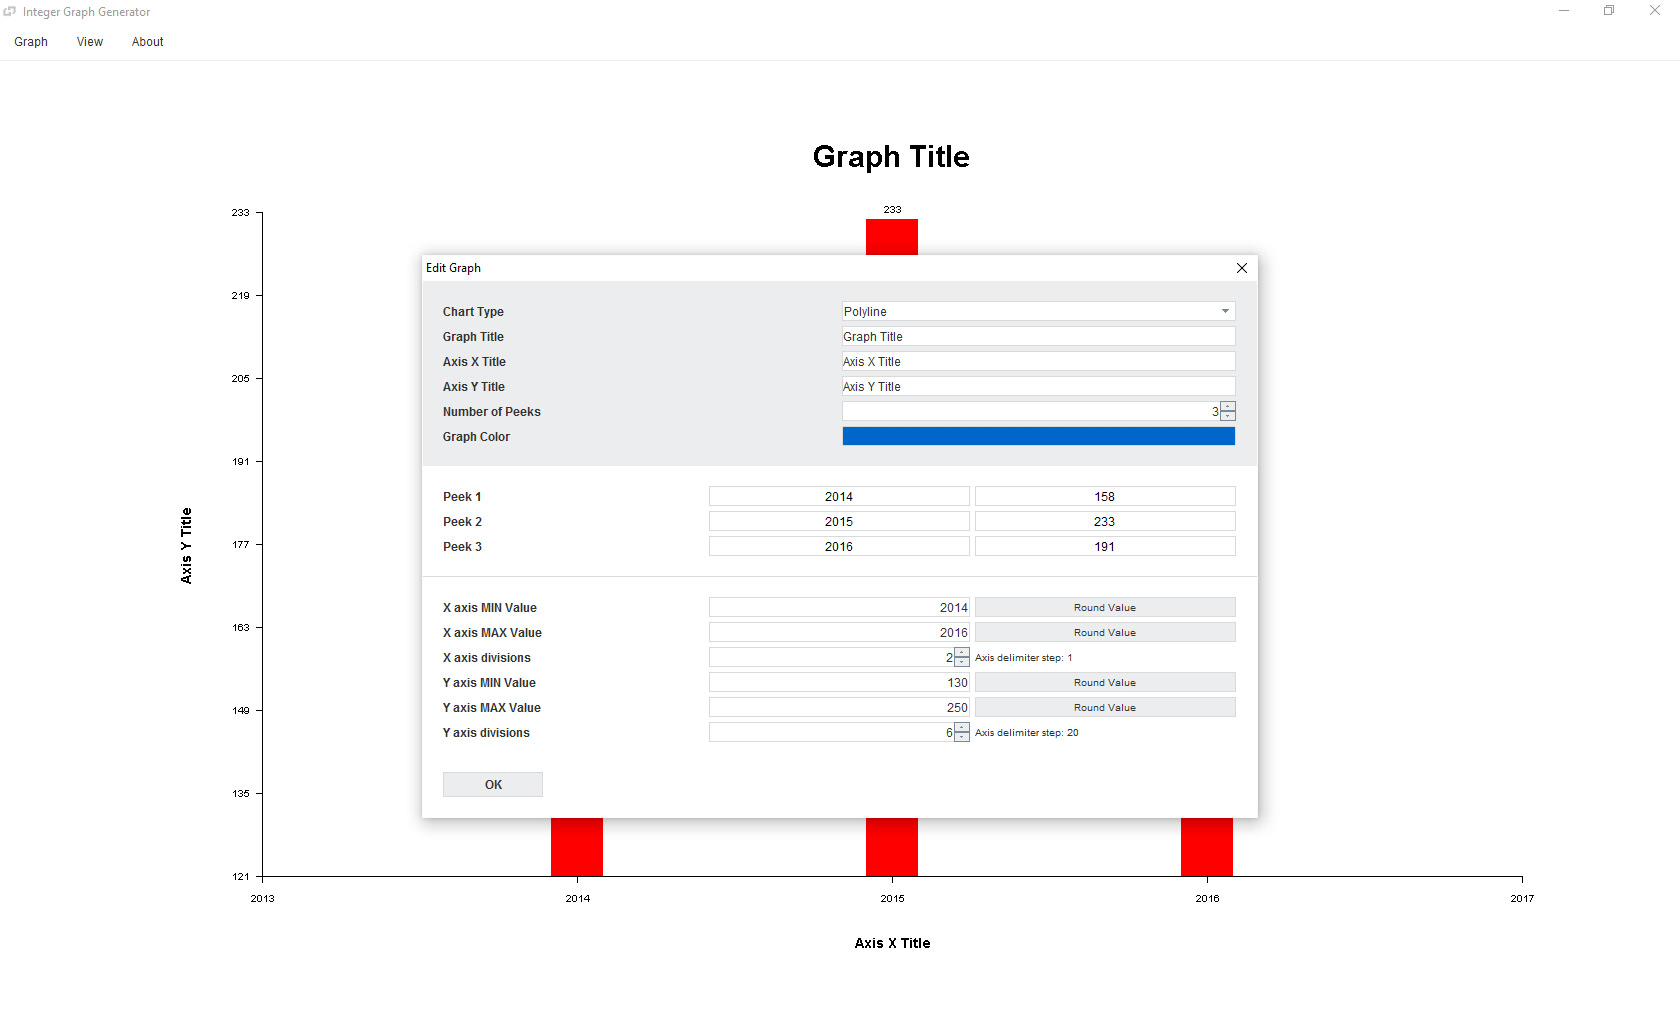
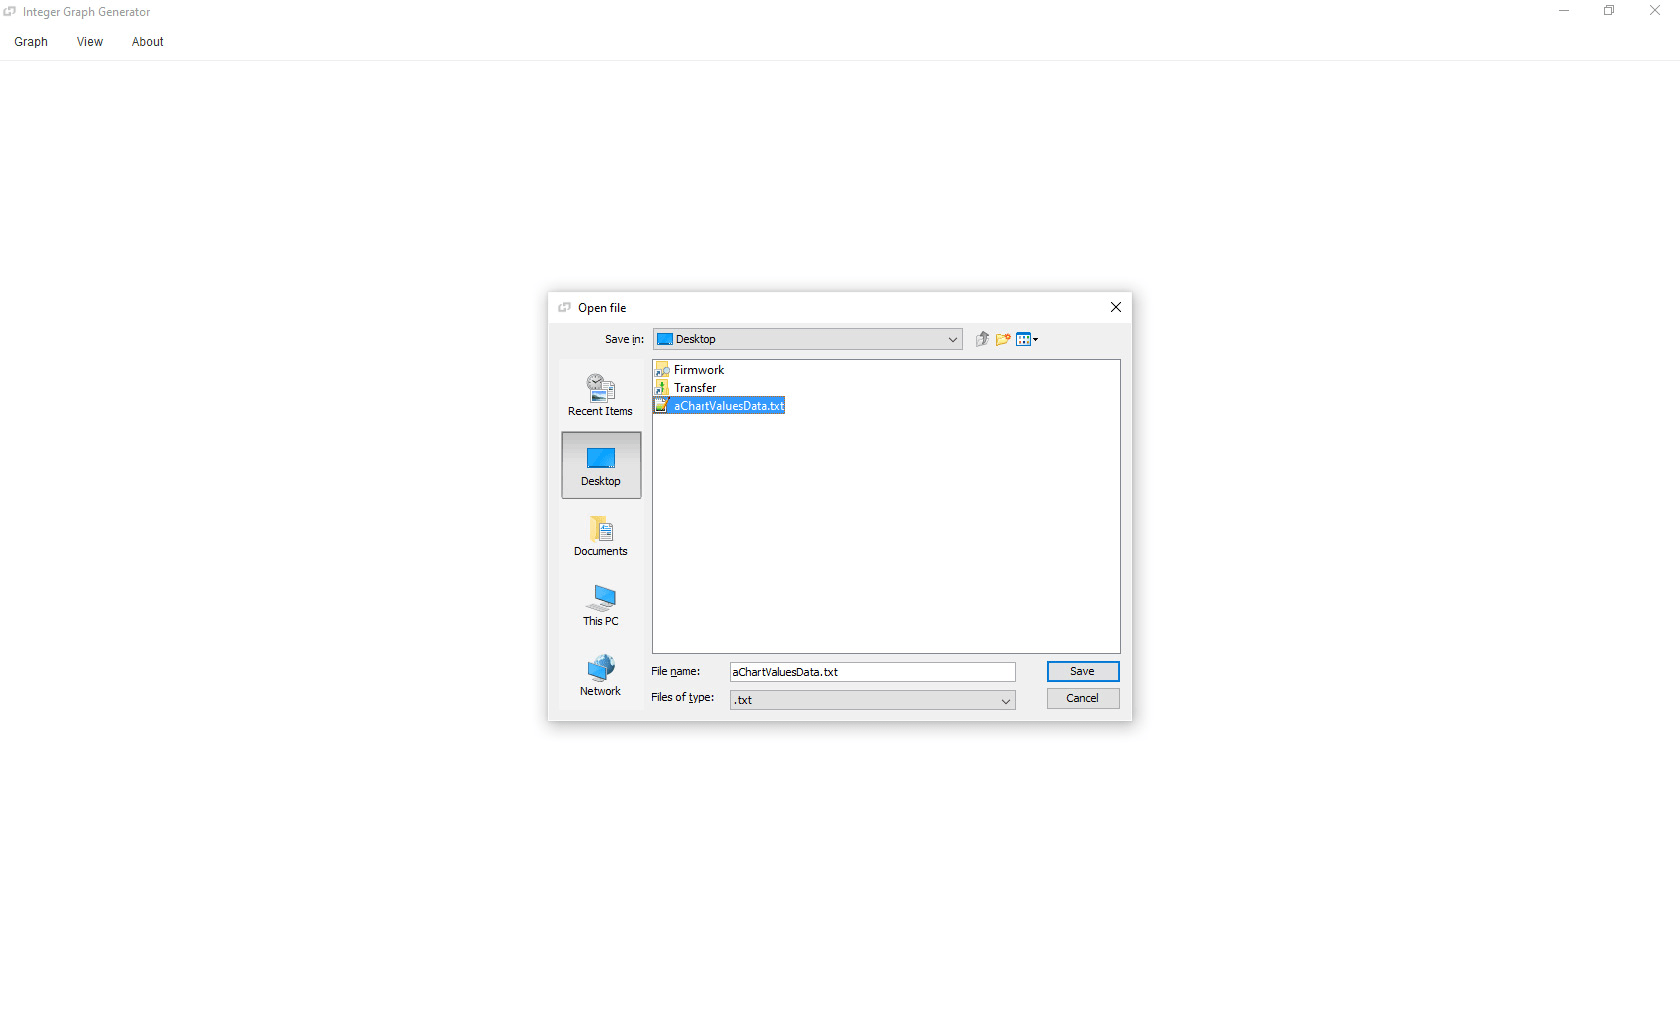
Every user can rapidly create polyline, horizontal or vertical columns graphs by entering graph title, X and Y axis subtitles, graph (chart) color and axises' proper positive integer values. Additionally, the user can customize the axises' start and end points or leave them as they are by the app's default calculations. The iGraph Generator will draw the result on the app's canvas, which can be easily exported to a vector PDF file or as text data for further imports.
Additional options are planned for future updates/versions.
Simple and fast software decision for generating vector PDF graphs (charts). The PDF graph file can be used for future presentations or in the design of business (audit) books or catalogues.


Comments not found