likwid (Like I knew what I am doing) is a project that contributes easy to use command-line tools for Linux to support programmers in developing high performance multi threaded programs.
It contains the following tools:
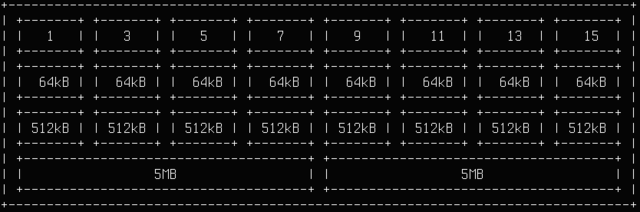
* likwid-topology: Show the thread and cache topology
* likwid-perfCtr: Measure hardware performance counters on Intel and AMD processors
* likwid-features: Show and Toggle hardware prefetch control bits on Intel Core 2 processors
* likwid-pin: Pin your threaded application without touching your code (supports pthreads, Intel OpenMP and gcc OpenMP)
There are already a bunch of performance counter tools available. Likwid stands out because:
* No kernel patching, any vanilla kernel with the standard msr module works
* Transparent, always clear which events are chosen, event tags have the same naming as in documentation
* Lightweight, LIKWID on purpose does not use sampling and adds no overhead during measurement.
* Easy to use, no java hog, simple to build, no need to touch your code, configurable from outside. Clear CLI interface
* Multiplatform, likwid supports Intel and AMD processors
* Up to date, likwid tries to fully support new processors as soon as possible
If you encounter problems feel free to ask questions in the User Mailing List.
NOTICE: Although Likwid is already fully usable Likwid is not yet released. I need your help to find bugs and improve Likwid to ensure a high quality for the release. Give it a try and test it. If you encounter problems write a email to me or the Forum. I promise a quick reaction time to fix errors or respond to feature requests.
What is new in this release:
- Support for Intel SandyBridge Uncore (partial) and Intel IvyBridge (only core part).
- A new application likwid-memsweeper to cleanup ccNUMA memory domains.
- Initial support for Intel Xeon Phi (KNC).
- Better support for AMD Interlagos.
- The OpenMP type is now detected automatically while pinning.
- Many bugfixes and improvements.
- The marker API works for threaded code and accessDaemon.
- Uncore support for timeline mode.
- A convenient macro wrapper for Marker API.
- Data volume as a new metric in all memory/cache groups. Updated Wiki documentation.
What is new in version 2.2.1:
- Initial support for Intel Sandy Bridge (Core) in likwid-perfctr.
- A new application, likwid-perfscope, as a frontend to the timeline mode of likwid-perfctr (experimental).
- Initial support for OpenMPI in likwid-mpirun.
- Improvements in likwid-msrD.
- A native Fortran 90 interface for the Marker API.
- A complete rewrite of the marker API.
- Simplified usage.
- Allows inclusive and overlapping regions.
- A new output filter subsystem.
- Allows you to define your own output file formats and filters.
- By default, comes with CSV and XML formats.
What is new in version 2.1.3:
- A hotfix for a build problem with direct MSR mode.
- Millisecond resolution for likwid-perfctr daemon mode.
- Improved error recovery for the MSR daemon.
What is new in version 2.1.2:
- fixes bug in likwid-mpirun script.
What is new in version 2.0:
- New application likwid-bench: A micro benchmarking platform
- likwid-pin supports now logical pinning among a node or sockets
- likwid-pin can set the NUMA mempolicy to interleave for an application
- likwid-topology also reports now on the NUMA topology
- likwid-perfCtr can print extensive documentation on the event groups
- Event groups in likwid-perfCtr can now be easily extended or modified
- Statistical output for threaded measurements in likwid-perfCtr
- Silent switch for likwid-pin
- Daemon mode for likwid-perfctr with lightweight monitoring
- likwid-perfctr supports now the Intel Nehalem EX core events
- Full support for AMD Magny Cours
What is new in version 1.1:
- Version 1.1 fixes a problem if using the perfCtr marker API together with OpenMP and using likwid-pin for pinning.
What is new in version 1.0:
- New Features:
- Lots of small improvements and fixes
- Support for Intel Westmere
- Initial support for Intel Atom
- Topology support for AMD Magny Cours
Comments not found