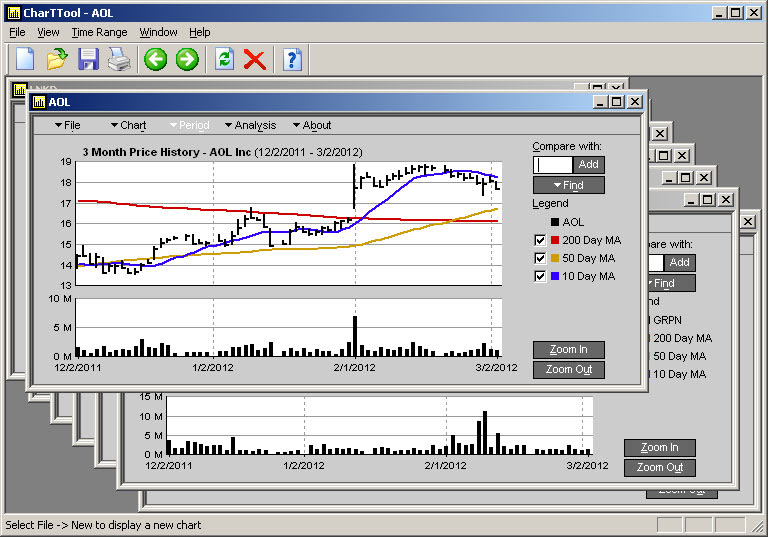
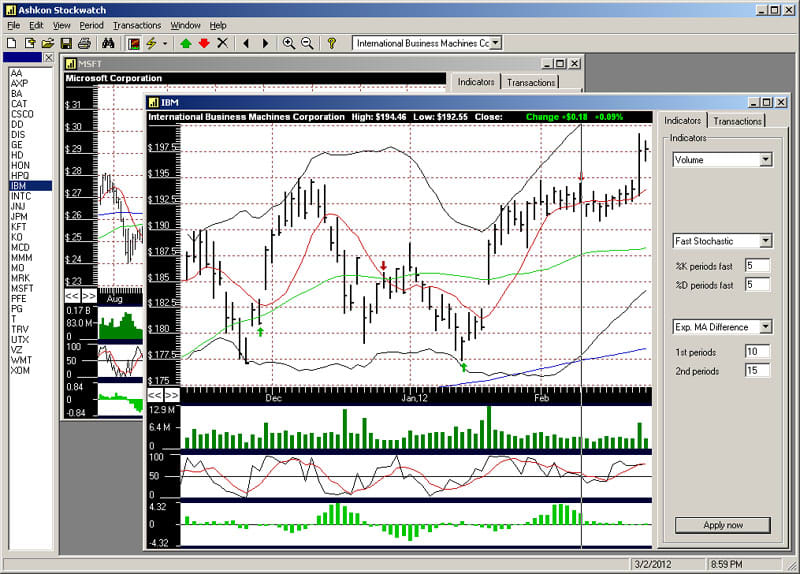
CharTTool is stock charting software. In addition to charting US and international stocks you may chart historical currency exchange rates, mutual funds and market indices. Intraday and end-of-day stock charting is supported. The list of technical indicators includes Bollinger bands, price channels, moving averages, fast and slow stochastic oscillators, RSI, MACD, trading volume and others. International stock exchanges are supported.
Offers stock charting intraday and daily. Supports international exchanges. Has built in technical analysis tool. Exports historical stock quotes data. Plots multiple securities on the same chart. Compares stock performance in percentage point over time. Offers various chart types: line, HLC bars
Stock charting software for stock traders. Active daytraders. Investors interested in the performance of their stock.

Comments not found