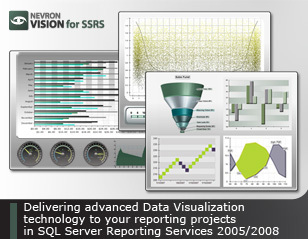
Nevron Chart for SQL Server Reporting Services (SSRS) is an advanced report item, delivering a complete set of 2D and 3D charting types, highly customizable axes, tight data integration and unmatched visual effects to your reports. It instantly improves your report authoring experience, with its polished visual editors, exhaustive and refined settings and well-organized structure. Nevron Chart for SSRS is an indispensible tool for any serious Business Intelligence, Scorecard, Presentation, Scientific or general purpose report.
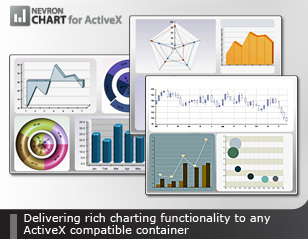
Features include: Multiple Charting Areas. Multiple Legends. Multiple Titles. Complete set of 2D/3D Charting Types. Advanced Axis Model. The industry-leading set of XY and XYZ scatter charts. The industry-leading support for 3D charting. The only chart for SSRS with Grid, Mesh and Triangulated Surface Charts. The only chart for SSRS with Photoshop-like effects. The only chart for SSRS with HTML-like rich-text formatting. Seamless integration with SQL Server Reporting Services 2005 and 2008.
What is new in this release:
Version 2016.1:
- Performance improvements
- Chart Calculated Series (Trend Lines)
- Others Pie Group
- Support for SQL Server 2012 SSDT
What is new in version 2015.1:
- Performance improvements
- Chart Calculated Series (Trend Lines)
- Others Pie Group
- Support for SQL Server 2012 SSDT
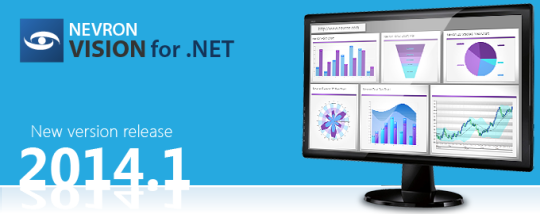
What is new in version 2014.1:
- Performance improvements
- Chart Calculated Series (Trend Lines)
- Others Pie Group
- Support for SQL Server 2012 SSDT
Requirements:
Microsoft SQL Server 2005/2008/2008 R2 Reporting Services - Business Intelligence Developer Studio
Limitations:
Watermark on document
Comments not found