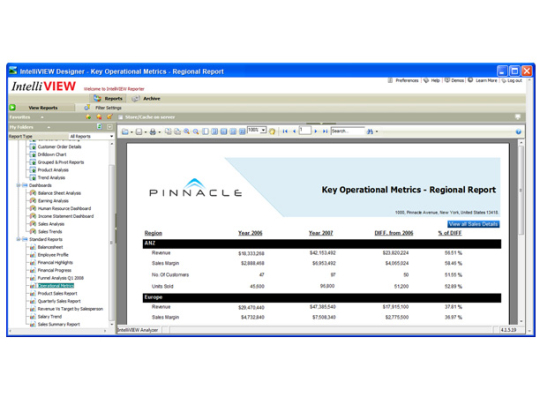
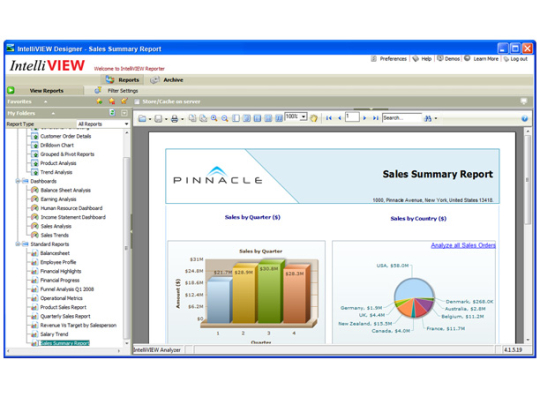
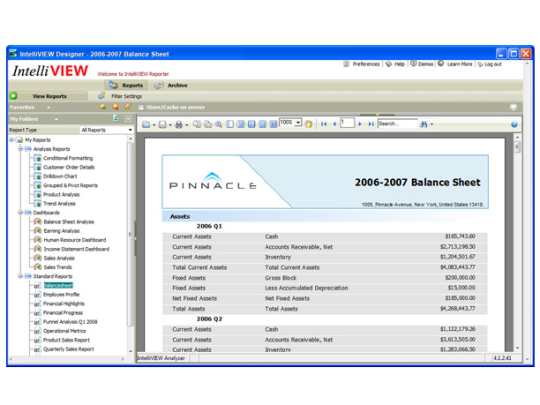
IntelliVIEW Designer enables report designers to connect to any structured data source, visually construct queries, build report formats and publish them to the IntelliVIEW Reporter server. Report elements include Tabular & Cross-tabular reports and Charts with multiple visualization options, such as Bar, Column, Pie, Funnel, etc. Most importantly, reports designed using IntelliVIEW Designer are interactive and flexible.
IntelliVIEW Designer delivers the following key results: Empowers business users with interactive reporting. Eliminates report customization & ad hoc report requests. Improves IT productivity. Rapid report design capabilities enable report designers to save up to 80% of report creation effort. Single-click deployment capability of reports to IntelliVIEW Reporter saves significant time. Minimizes ongoing report maintenance & management effort. Minimal IT overhead, ease-of-deployment, ease-of-use and increased business user & IT productivity ensure rapid ROI.
What is new in this release:
Version 4.1.5:
- Charting modules that empower users with enhanced data visualization capabilities.
- Date Analytics: Enables user to specify settings like Start of quarter, Start of week and Hour Format before Grouping by Calendar.
- Analysis Reports: Filters can be applied to all tabs and column names can be used as Chart labels.
Limitations:
45-day trial
Comments not found