Users may have lost data of a chart, keeping only the chart. Or users may have a chart from a paper which does not give the data.
By simply clicking on the picture, Digitizer will calculate coordinates and give you (X,Y) data in your favorite spreadsheet.
How-To
Step 1. Load your picture of the chart (from image file, or PDF file, or clipboard). You may also:
Resize
Crop
Rotate your picture
Step 2. Define axis scales:
XY or polar coordinates
linear or log scale
time or date for X axis
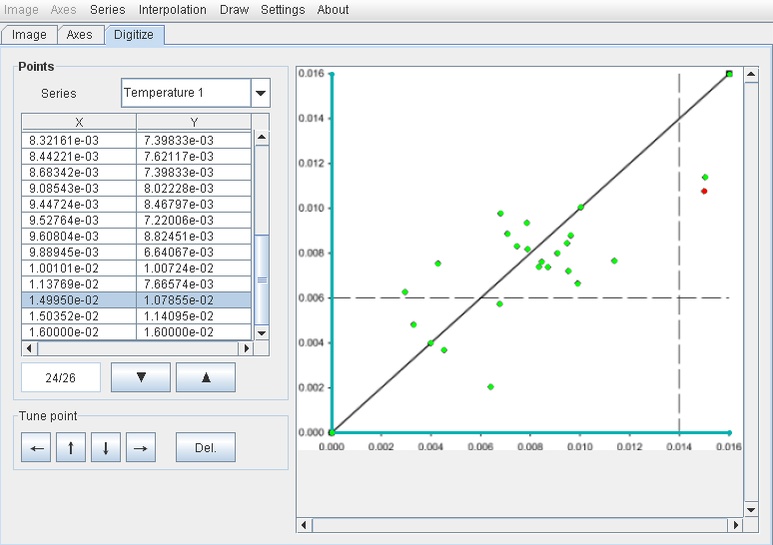
Step 3. Create a series, then click on the points of the chart. You may choose:
color and shape of the pointer
to display or not other series, axis, lines between points
size of the points and the lines
Step 4. Save in your spreadsheet or CSV file:
one series per sheet/file
all series in the same sheet/file
Requirements:
- LibreOffice
Comments not found