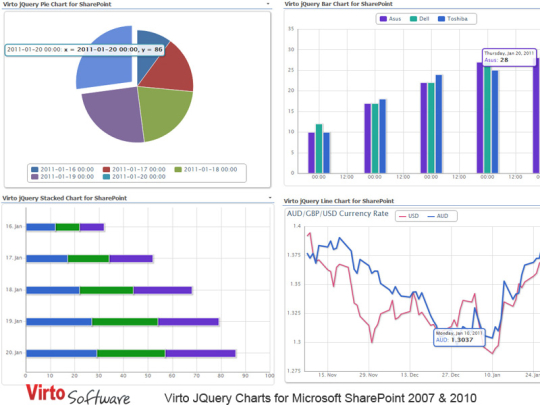
Virto Charts is a jQuery-based control for creating plots, graphs and charts in Microsoft SharePoint. Virto component produces beautiful line, bar and pie charts with many features. Charts can be based on a variety of data sources, including SharePoint Lists, SQL tables, XML etc. Key Features 1. SharePoint list, SQL database, XML file data sources 2. Ability to define chart height and width or diameter in pixels 3. RGB color coding for line and bar charts 4. Using chart zoom 5. Using stacked chart option 6. Highlighting data points 7. Ability to define colors for grid RGB color coding of X and Y axes 8. Axis auto scaling (automatic definition of minimum and maximum) 9. Showing/hiding chart title and placing it in different positions 10. Showing/hiding chart legend and placing it in different positions 11. Ability to hide data source on chart 12. Filtering options for displayed data 13. Value grouping and data aggregation for Y axis 14. Ability to define data format for X axis of date and time type Editions for SharePoint 2007 and 2010 versions
Requirements:
Microsoft Windows Server 2003 or 2008 Microsoft SharePoint Server 2007 or 2010
Limitations:
30-day trial

Comments not found