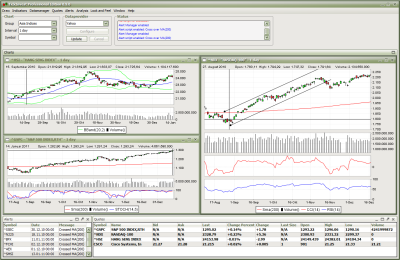
TickInvest is a professional stock charting and technical analysis software with realtime and eod charts. It has 29 Indicators are ready to use, to analyze your favorite stocks. Drawing tools helps you to keep track of resistance and support zones. Realtime quotes inform you about stock price changes. It's easy to use script language enables you to backtest your own trading strategies, find stocks, create indicators or stock pattern alerts. You can even create your own drawing tool using the script language. In addition to the script language, you can create custom plugins using java programming language.
What is new in this release:
Version 1.5.1 has added trade simulator start date detection and fixed trail stop calculation.
Limitations:
Some features disabled
Comments not found