Software Screenshot:
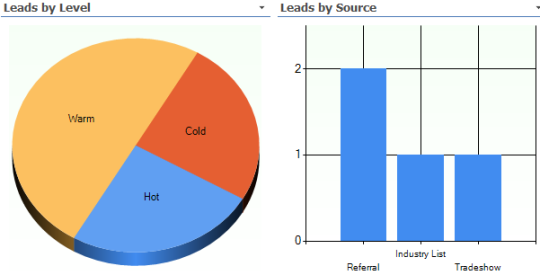
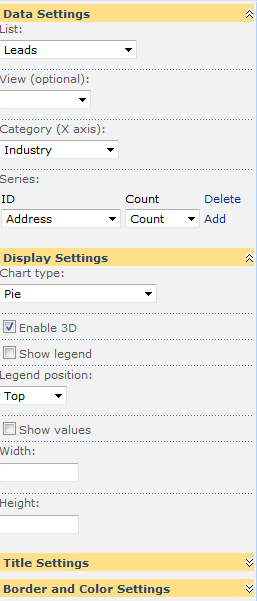
With Smart Chart Lite show your list data as a configurable chart. Visualize and summarize your data in easy-to-understand chart format. You can count, sum-up or calculate the average value for any single columns. If you want to use more than one column or even connect the chart to a list view web part to filter the raw data according to the selected chart category value.
What is new in this release:
Version 1.4.4 has improved support for calculated columns.
Requirements:
Microsoft .NET Framework 3.5, SharePoint Services 3.0 or SharePoint Foundation 4.0

Comments not found