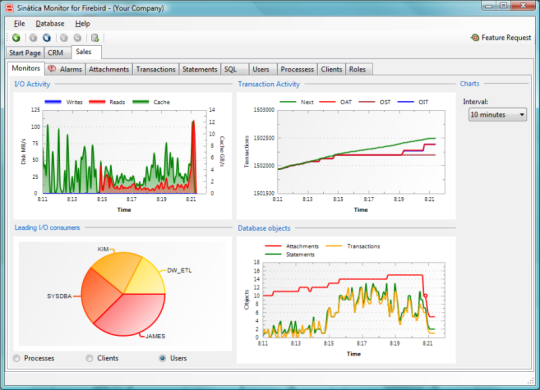
Sinatica Monitor can help you increase your Firebird server's performance. Sintica Monitor makes the job of identifying slow SQL statements easy. You just set the Slow Statements Alarm, and from then on Sinatica Monitor generates an Alarm Report for each incident. This report contains the complete SQL statement identification, along with statistics that will help you understand why it is slow. Using the Greatest I/O Consumers Chart, you watch in real-time who is consuming the largest amounts of resources from the disk subsystem - processes, users and clients. This information allows you to focus on correcting the biggest consumers and obtaining more expressive performance results in less time. In addition, Sinatica Monitor also tracks every SQL statements' Table Scan Index. When some statement executes a Table Scan and consumes a lot of disk I/O, Sinatica Monitor generates a report that completely identifies the statement along with I/O statistics.
Version 2.0 features redesigned History View; monitoring filters; export to Excel; interactive alarms; efficiency enhancements.
What is new in this release:
Version 2.0 features redesigned History View; monitoring filters; export to Excel; interactive alarms; efficiency enhancements.
Requirements:
Microsoft .NET Framework 2.0, Firebird 2.1
Limitations:
Some features limited
Comments not found