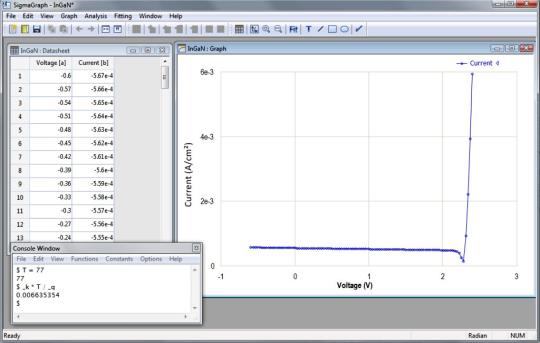
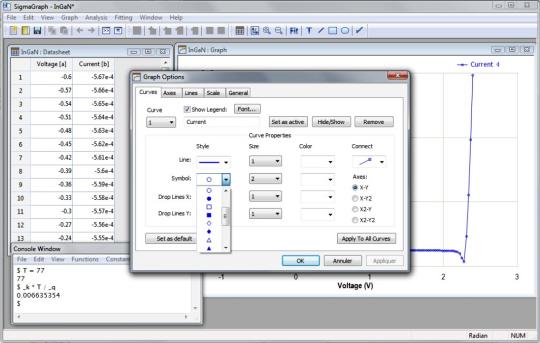
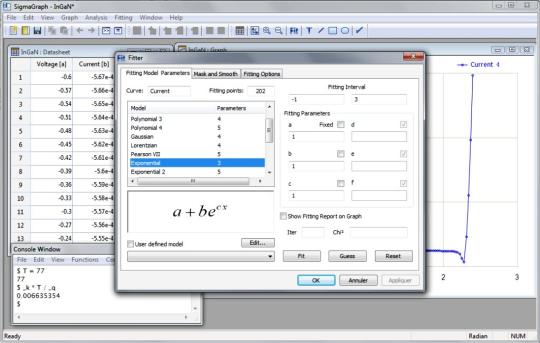
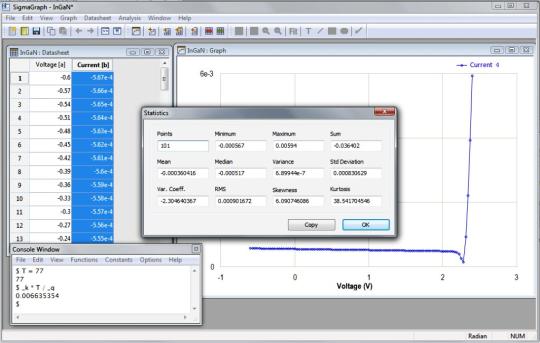
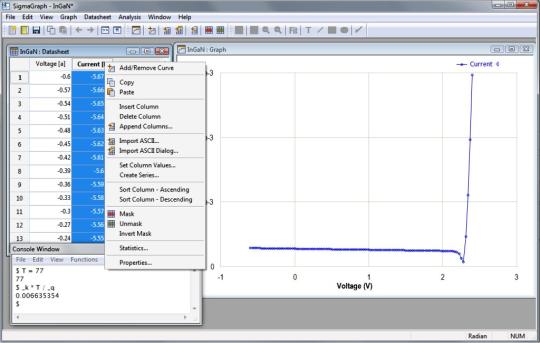
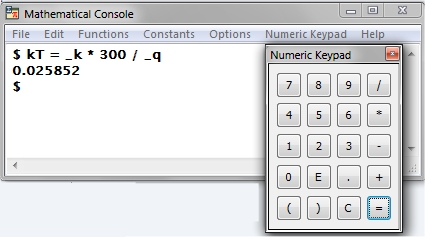
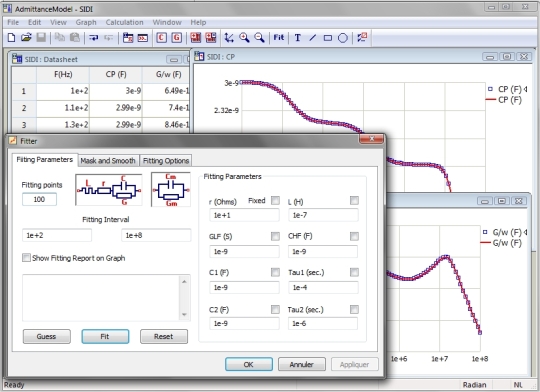
SigmaGraph is a data plotting and analysis software designed to be lightweight, reliable and easy to use. SigmaGraph runs on XP, Vista and Windows 7/8, and will be ported to GNU/Linux. SigmaGraph offers almost all the functionality needed by scientists and engineers: editable datasheets (column properties, create series, set column values by using any mathematical expression, show column statistics, import/export from/to ASCII file, mask and unmask cells, printing); scientific graphing with a complete control of the graph (line/symbol style, colors, fonts, legends, axis properties, grid, tick, labels, scale, auto scale, log/linear scale, zoom in/out, copy format to another graph, export as image, printing, etc.); curve fitting (up to twenty models including linear, polynomial, exponential, Gaussian, Lorentzian, Pearson VII, logistic, power, and user-defined models); error bars (percentage, constant or any user defined data); drawing tools (line, rectangle, ellipse); mathematical console; Scripting engine.
What is new in this release:
SigmaGraph v2.6 (Release: May 13, 2014) - New fitting functions: Multi-peak Gauss and Lorentz (up to 5 peaks); - Scripting engine updated with new mathematical and statistical functions; - Script editor enhanced with new options: syntax highlighting, line numbers, markers, autocompletion, ... - Data importing new options; - Graph printing bug on some devices corrected; - Help system redesigned (integrated HTML Help and PDF); - User interface enhancements; - Performance improvement. - Bug fixes.


Comments not found