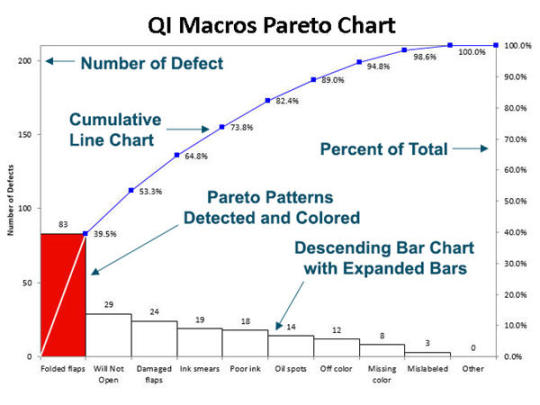
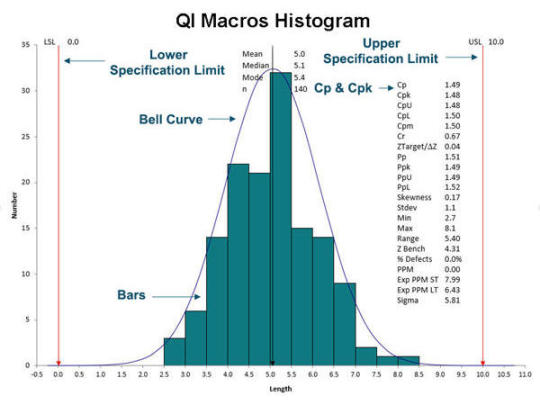
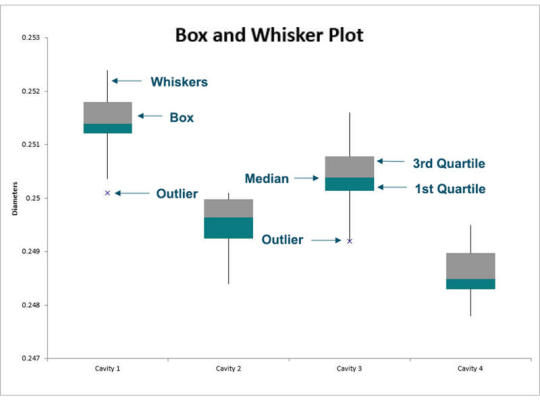
QI Macros SPC Software for Excel is an affordable, easy-to-use Excel add-in for all of your data analysis needs. It draws Pareto charts, histograms with Cp Cpk, box whisker plots, scatter and control charts. It contains over 100 Lean Six Sigma fill-in-the-blank templates such as an automated fishbone diagram, value stream map, QFD, DOE, FMEA, PPAP forms and MSA Gage R&R. It performs statistical analysis tests including ANOVA, t-test, F-test, and regression analysis.
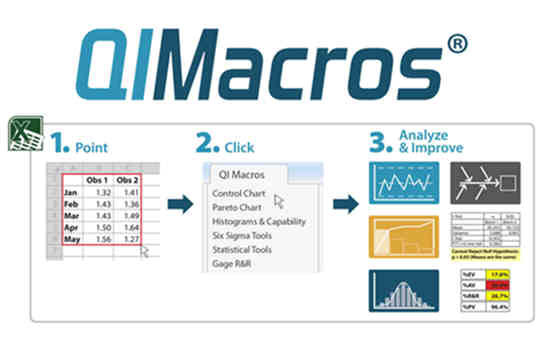
This Excel add-in will deliver immediate results in business environments using Grab-It-And-Go Simplicity and mistake-proof selection of data. Your data can be connected or separated or in rows or columns. QI Macros will clean up nonnumeric data, fix any misalignments and use your data as you selected it.
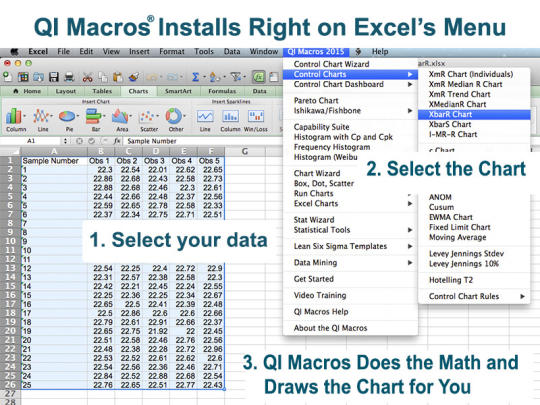
QI Macros wizards contain functionality not included in any other six sigma or statistical process control software. The Control Chart Wizard selects and runs the right control chart for you. The Pivot Table wizard analyzes your data and creates a pivot table for you. The Data Mining wizard combines the power of the Pivot Table and Control chart wizards and automatically creates control charts and pareto charts from a data spreadsheet with one click. The Statistical Wizard selects and runs the right statistical tests and even interprets the results for you (e.g. reject or accept the null hypothesis, mean / variances are the same or different). Mistake-proof your six sigma data and statistical analysis using this powerful tool.
QI Macros is compatible with PC and Mac, Excel 2000 to 2016 and Office 365. We have over 100,000 users at 2,500+ hospitals and thousands of manufacturing companies world-wide. QI Macros is a single user perpetual license with no annual fees. There is no charge for technical support. Academic and quantity discounts are available. Free training resources and a 30 day trial is available for download on our website at qimacros.com.
What is new in this release:
Version 2016.08:
- Enhanced Data Mining Wizard - creates a pivot table of data, and generates an XmR chart and defect Paretos with one click.
- Pass - Fail Cp Cpk calculator added to Capability Templates
- Fever Chart added to Diagrams
- Frequency Polygon added to Compare 2 Histograms template
- Test data is now accessible from the QI Macros help menu
- Added OEE template to the Rolled Throughput Yield Calculator
- Sample Size Calculator expanded; separate calculators for attribute data and variable data.
What is new in version 2016.04:
Version 2016.04:
- New Data Mining Wizard creates a pivot table of data, and generates an XmR chart and defect Paretos with one click.
- Made Pooled Standard Deviation the default estimator for Cp and Cpk. Sbar/c4 and Rbar/d2 can still be used by changing the estimator field.
- Enhanced Gantt Chart Template
- 3 Legged 5 Whys Template
- Short Run Control Charts Consolidated in one Template
- Standard Work Template for Lean.
- Sample Size Calculator expanded; separate calculators for attribute data and variable data.
What is new in version 2015.01:
- Automated Ishikawa Fishbone Diagram
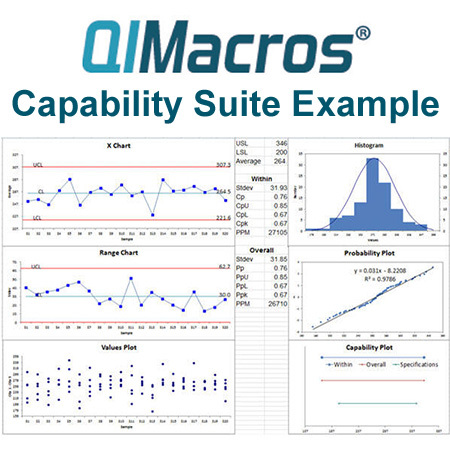
- Capability Suite of Six Charts
- Levey Jennings Control Chart Dashboard
- Fixed Limit Control Charts
- Histogram with Weibull Analysis
- Create Side by Side Histograms
- Remember and Apply Custom Excel Chart Formats for Re-use
- Charts added to Results of Statistical Tests
Requirements:
Microsoft Excel 2003-2013 or Office 365
Limitations:
30-day trial


1 Comments
An 18 Dec 18
Can you give me a VBA password ?. I really need it