Software Screenshot:
Software Details:
Version: 2.1
Upload Date: 28 Oct 15
Developer: Praeter Software
Distribution Type: Shareware
Price: 11.95 $
Downloads: 38
Size: 1100 Kb
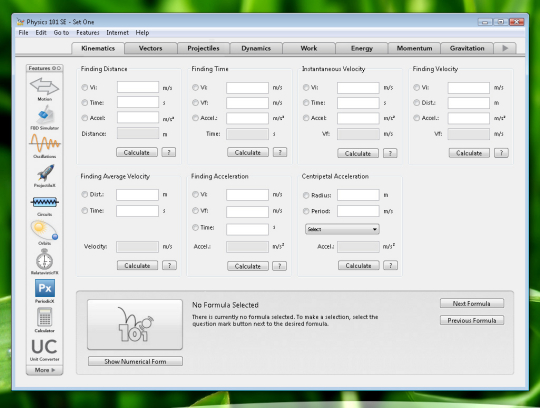
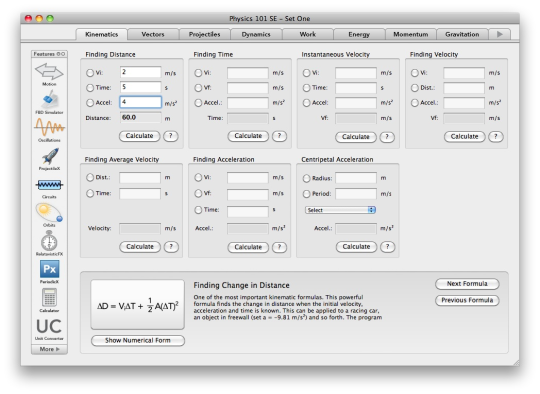
ProjectileX is a tool aimed for physics students and rocketry applications. It allows the user to visually plot a trajectory of an ideal projectile or with one of local linear drag. Simply enter in initial velocity, theta, gravity, (and vertical and vertical landing positions optionally) to graph the projectile. After this, you will know Vx, Vy, total distance, total time, time of height max, height max, final velocity, and so on.
The program remembers the last four graphs, so you can quickly review previous graphs. In addition, if you move the mouse over the graph, you can see the X,Y, and Time calculated in real time. In addition, data tables can be shown for both ideal and local linear drag.
What is new in this release:
- Updated the ProjectileX tracker system to be much more intuitive
- ProjectileX no longer has graphic artifacts when switching tables
Comments not found