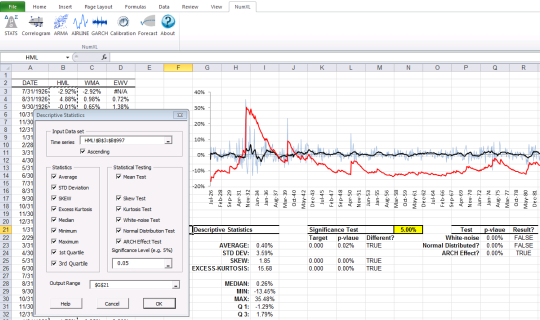
NumXL is a Microsoft Excel add-in for econometrics and data analysis, designed to make finance modeling and time series easier to manage. You can perform all of your data work right in Excel. NumXL allows you to apply advanced econometric analysis quickly and easily via an intuitive user interface. You can track and make changes to your data and share your analysis, modeling and results with just one file. In just a few clicks, you can analyze, build, validate, back-test and forecast your models. NumXL Functions are organized into 11 categories: - Descriptive Statistics - histogram, KDE, EDF, Q-Q plotting and autocorrelation function - Statistical Tests - mean, standard deviation, skew, kurtosis, normality,colinearity, serial correlation (white-noise), ARCH effect, homogeneity, ADF unit root and cointegration test - Transformation - BoxCox, difference, integral operators - Smoothing - weighted moving average, exponential smoothing and trend - Simulation - Monte Carlo Simulation. - ARMA Analysis - conditional mean modeling (ARMA/ARIMA/ARMAX), SARIMA, AirLine, U.S. Census X-12-ARIMA support - ARCH/GARCH Analysis - conditional volatility and heteroskedacity modeling (ARC/GARCH/E-GARCH/GARCH-M) - Combo Models - log-likelihood, AIC, residuals diagnosis, parameters' constraints check, forecast, etc. - Factor Analysis - Generalized Linear Model, Principal Component Analysis (PCA), and Multiple Linear Regression (MLR) - Date/Calendar - weekday and holiday calculations - Utilities - interpolation, statistical functions - Spectral Analysis - Discrete Fourier Transform, Hoderick-Prescott filter, Baxter-King filter and Convolution NumXL Pro is compatible with all Excel versions from '97 to 2013 (34-bit and 64-bit) and with Windows 9x through Windows 8 systems.
What is new in this release:
Version 1.63.42402.1: New models: ARIMA, SARIMA, ARMAX and SARIMAX. Model-based and Monte-Carlo Simulation Support. Support for subset of the lags list in ARMA-family models. Support for calculating optimal coefficients' values in the model wizard. Generate excel-type notes in the output labels or headers cells to illustrate their Revised functions for calculating optimal coefficient values and their standard errors.
What is new in version 1.60.41418.1:
Version 1.60.41418.1 has fixed the forecast icon in NumXL tab is disabled.
Requirements:
Microsoft Office 2002-2003, 2007, 2010 or later
Limitations:
30-day trial
Comments not found