Software Screenshot:
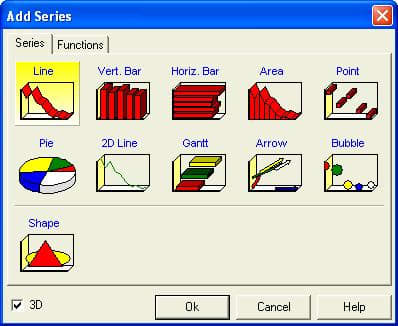
MyPlot is similar to a text editor but works for plotting. With this program, chart manipulation turns into text editing. You can easily and quickly create, edit, save and print out various types of graphs: Bar, Pie, Line, Gantt, Area, Bubble, etc. You can export the plotted charts to common graphics formats (BMP, WMF or EMF). You can change:
- Position, size and appearance of chart elements
- Fonts of chart elements
- Quantity and type of diagrams and statistical functions on the chart
- Data according to that are plotted series and statistical functions
When adjusting the appearance of the chart, all changes are immediately displayed on the screen. Data for a diagram can be obtained by many ways:
- Enter them manually using the special data table
- Copy data from other tables via Windows clipboard, for example: Word or Excel tables
- Import data from files
- Use various mathematical functions


Comments not found