Software Screenshot:
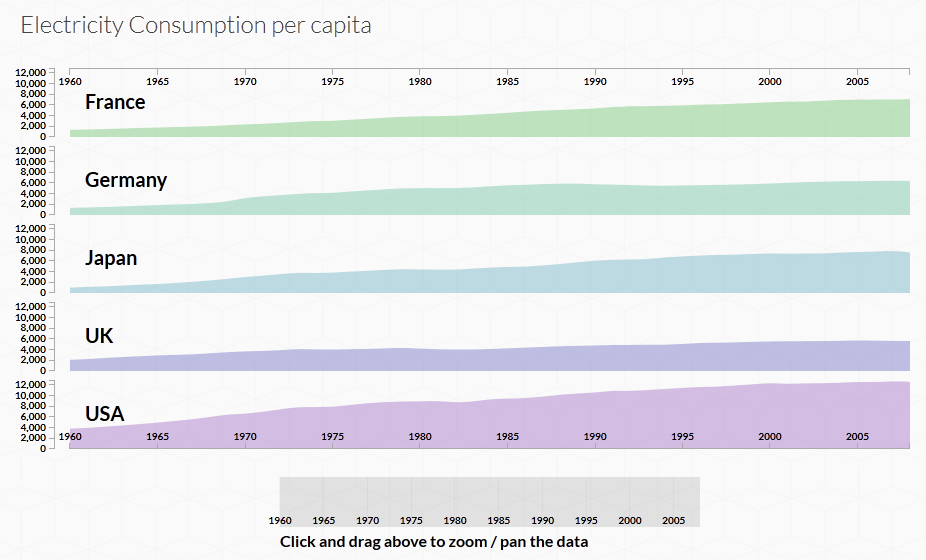
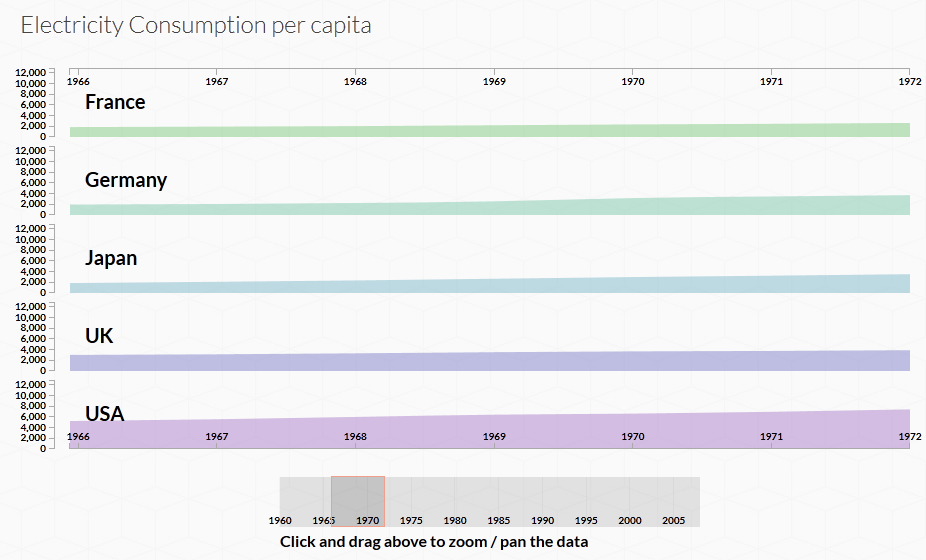
This library allows creating graphs that can be zoomed and then panned with the aid of a slider, just like in Google's financial charts.
Created with D3.js, the graphs can be used to show large statistical data, that spans across a large time period and has many detailed data points.
Relies on SVG and Canvas to render out the graph and its animations.
A working demo is included with the download package.
Requirements:
- JavaScript enabled on client side
- D3.js

Comments not found