jQuery Google Charting relies on the user to provide the data, the Google servers doing the rest, interpreting and rendering out the graphs as easy to embed PNG or GIF images.
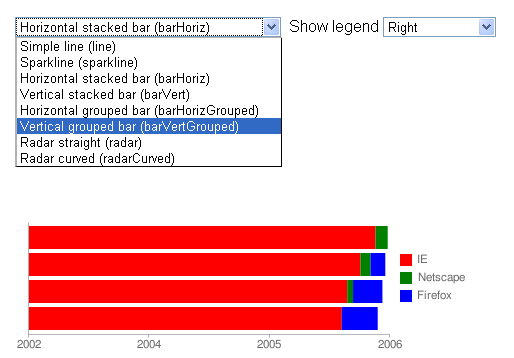
The plugin can produce various chart types, and even plot out QR codes.
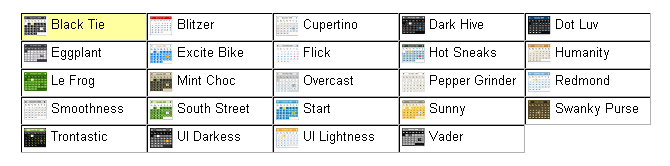
Developers can customize various chart details, from colors, to margins, to the chart size, and various other settings.
A demo is included with the download package, along with lots of documentation about how the plugin's options can be used to customize the charts.
Features:
- Complete coverage of the Google Chart API
- Display maps with country or US state data
- Show a Google meter or a Venn diagram
- Support for real-time animated charts
- Generates QR codes
- Show legend fields
- Show axis labels
- Show chart title
- Show ranges
- Show background grids
- Show data markers
- Supported chart types:
- Line
- Bar
- Pie
- Radar
- Scatter
- Stacked
- Sparkline
What is new in this release:
- Updated underlying plugin framework.
- Marker class changed from hasGChart to is-gchart.
What is new in version 1.4.3:
- Added embeddedChart function to icons module.
What is new in version 1.4.2:
- Allow free-standing icons
- Added colorVaryIcon, sizeVaryIcon, colorSizeVaryIcon, stackingIcon, stackingColorVaryIcon functions to icons module
- Allow widths of gradients and stripes to be specified
- Series may have gradient or stripe backgrounds
What is new in version 1.4.1:
- Added secure setting
- Renamed legendSize to legendDims
- Added legendColor and legendSize options
- Added lineColour parameter to axis function
- Added color function to GChartAxis object
- Allow zeroes value in a number format to be the number of zeroes
What is new in version 1.4.0:
- Refactored to separate out less common functionality and reduce main plugin size.
- The jquery.gchart.ext.js module now contains the graphviz, map, meter, qrCode, scatter, and venn functions and associated map and QR code options.
- The jquery.gchart.icons.js module now contains the basic icon function and icons option.
What is new in version 1.3.1:
- Added format setting to set image format.
- Added provideJSON setting to include a JSON description of the chart in the onLoad callback.
- Added usePost setting to use the POST method to allow for larger chart requests.
- Added candlestick as a synonym for the financial marker type.
What is new in version 1.3.0:
- Added opacity setting to set opacity of entire chart
- Added legendOrder setting to control order of items in a legend
- Added 'formula' chart type
- Added labels and colours to scatter for a legend
- Added format setting to axis
- Allowed vertical slices for series fills
- Added marker shapes annotation, errorbar, horizbar, rectangle, and sparkslice
- Added placement and offsets settings for markers
- Added icons setting for dynamic icons on charts
- Added icon, bubbleIcon, mapPinIcon, noteIcon, weatherIcon, and outlineIcon functions to assist with dynamic icons
- Added multiple values and labels to Google Meter
- Added labels and styles to Google Meter
- Maps may have a colour gradient for regions with data
- Converted appropriate attributes to numbers in seriesFromXML
- Added name/value option to 'change' command
What is new in version 1.2.3:
- Added onLoad setting.
Requirements:
- JavaScript enabled on client side
- jQuery 1.7 or higher

Comments not found