Software Screenshot:
Software Details:
Version: 1.3.8
Upload Date: 15 Apr 15
Developer: Institute of Mathematics and Statistics
Distribution Type: Shareware
Price: 15.00 $
Downloads: 23
Size: 1605 Kb
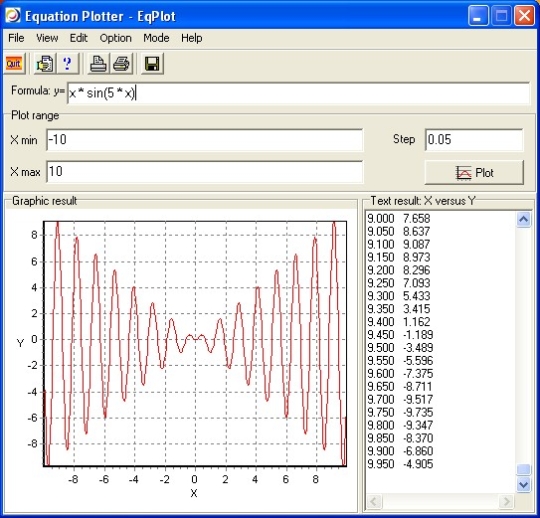
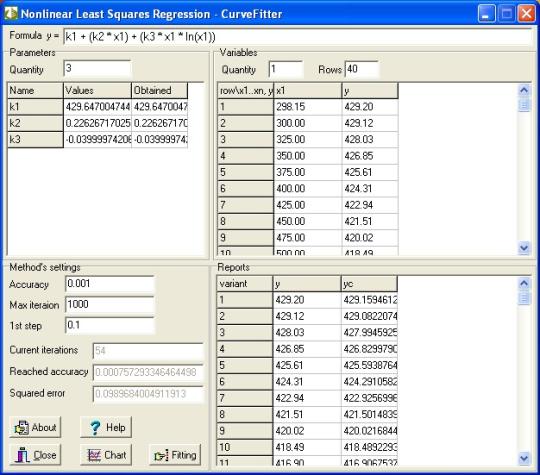
Graph plotter program plots 2D graphs from complex equations. The application comprises algebraic, trigonometric, hyperbolic, and transcendental functions. EqPlot can be used to verify the results of nonlinear regression analysis program. Equation graph plotter gives engineers and researchers the power to graphically review equations, by putting a large number of equations at their fingertips. The program is also indispensable for students and teachers. A flexible work area lets you type in your equations directly. It is as simple as a regular text editor. Annotate, edit and repeat your graphing in the work area. You can also paste your equations into the editor panel.
Limitations:
Limited functionality
Comments not found