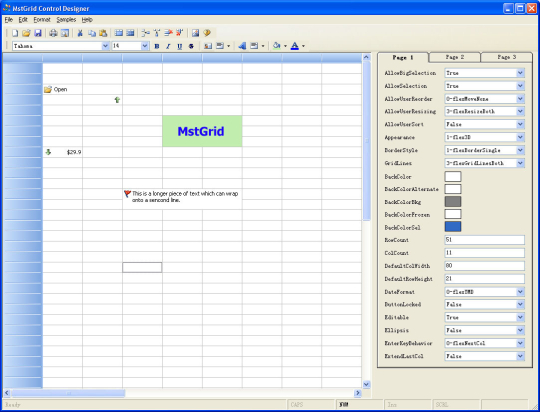
Software Screenshot:
The CLR Profiler includes a number of very useful views of the allocation profile, including a histogram of allocated types, allocation and call graphs, a time line showing GCs of various generations and the resulting state of the managed heap after those collections, and a call tree showing per-method allocations and assembly loads.
Requirements:
Windows 2000/XP/2003 Server
Comments not found