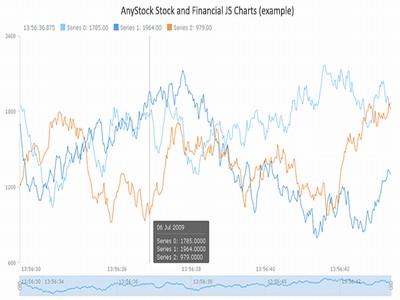
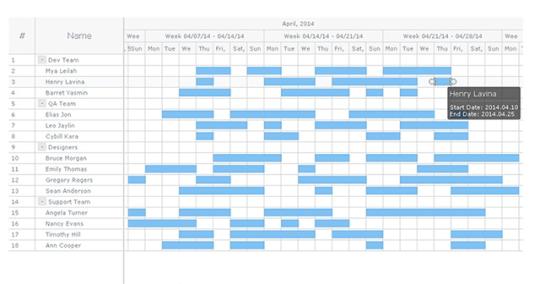
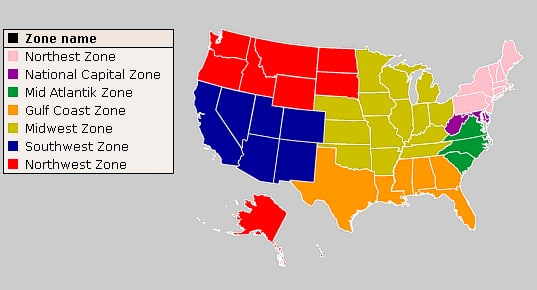
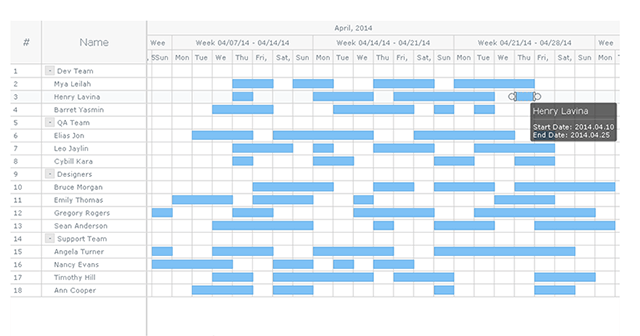
AnyChart Stock and Financial JS Charts (short name: AnyStock) is a JavaScript based financial and stock charting library. AnyStock technology turns your real-time data into highly sophisticated charts with interactive features, bringing visualization of your data to the Web and providing a full feature set for creating real-time streaming and data manipulation applications. Designed to display date and time based information, AnyStock is the ideal tool for client reporting and performance reporting applications. Reports and Dashboards are visualized with scrolling, drill downs, panning and zoom functionality available in all of our HTML5 charts. AnyStock brings analysis of your FOREX, commodity and investment market data to life. The ability to review long term and large data sets can easily be handled with scroll, pan, and zoom controls. AnyStock is fully integrated into AnyChart 7 Framework and shares most of its ideology, settings technique and ease of use - and you can use AnyStock along other charts including those available in the AnyChart JavaScript Charts, AnyGantt JavaScript Gantt Charts, and AnyMap JavaScript Maps. AnyStock supports a wide range of stock chart types (including Candlestick, OHLC, Line, Spline, Column, Step Line, Area, Step Area, Spline Area, Marker, Range Column, Range Area, and Range Spline Area JS charts) and technical indicators (MACD, ROC, RSI, SMA, EMA, and custom). Drawing tools (including Line segment, Ray, Trend line, Trend channel, Andrew's pitchfork, Fibonacci fan, Buy/Sell signals, and many others) and adding of news events (analyst opinions, insider trading, dividends, and key developments) to improve the ability to analyze information effectively are also available and have made an important contribution to the superfast HTML5 visualization of stock/financial data with AnyStock JS.
What is new in this release:
Opened source code. Plugins: Angular, React, Ember, Meteor, NodeJS, jQuery. Technical indicators: AMA, KDJ, BBands, Stochastic... Customs series drawing. Step Line Backward/Forward, Stick, Jump Line charts. Individual point settings. New legend customization options. Sharing on social media.
What is new in version 7.12:
Version 7.12 adds localization Support. Switching between 196 different regional settings while all date/time chart elements update themselves. Range Selection UI - controlling data grouping and time interval is paramount in financial data and stock charts. New UI elements help add range selection to your apps.
Limitations:
Trial preloader, trial message on output
Comments not found