Software Screenshot:
Software Details:
Version: 8.0.3
Upload Date: 17 Feb 15
Developer: ej-technologies GmbH
Distribution Type: Shareware
Price: 499.00 $
Downloads: 57
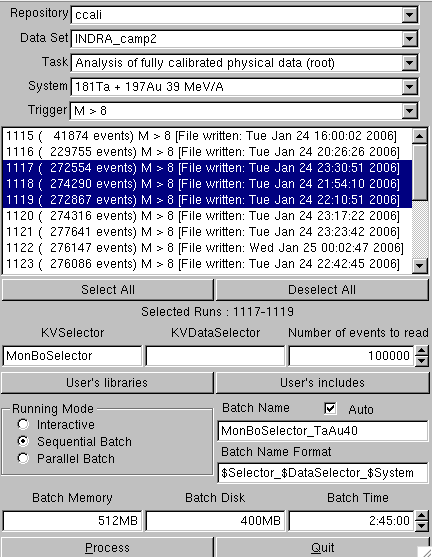
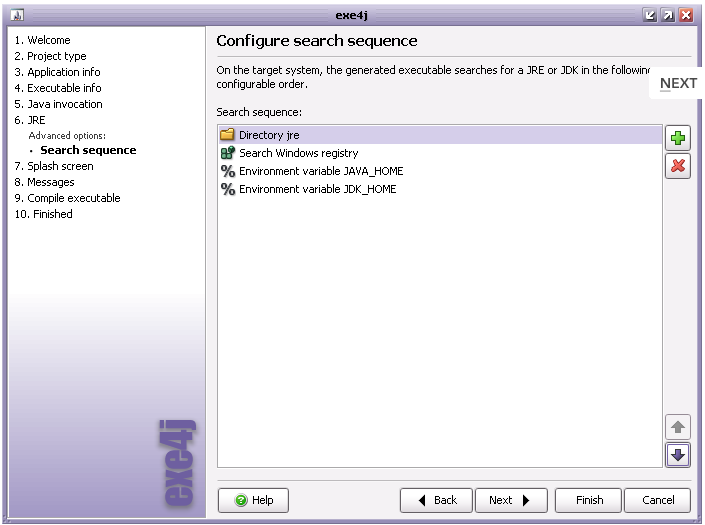
JProfiler is a commercial and cross-platform award-winning all-in-one Java profiler.
Because it is written in Java, JProfiler can be used on Linux, Mac OS X and Windows platforms.
Features:
- Live profiling of a local session
- Live profiling of a remote session
- Offline profiling
- Snapshot comparisons
What is new in this release:
- New features:
- Bundled integration for IntelliJ IDEA 13 (the newest IDEA plugin is always available in time from the IDEA plugin manager)
- Bugs fixed:
- Fixed problems when reading incorrect stack map tables generated by external byte code modifications
What is new in version 8.0.2:
- New features:
- If the system property "jprofiler.displayName" is set the the profiled JVM, it is used in the list of locally detected JVMs
- Bugs fixed:
- Reduced overhead of sampling with URL splitting enabled
- Numbers in CSV export of telemetry views had grouping separators
- Object sizes in PHD snapshots could be wrong
- Fixed exceptions when opening certain PHD snapshots
- "Save HPROF snapshot" action did not work with OpenJDK
- IDE integrations: When overhead hotspots were confirmed after the session was disconnected, they were not saved for subsequent runs of the same run configuration
What is new in version 7.2:
- This version adds an RMI probe, a Web services probe and more flexible offline profiling from the commandline, URL request splitting in the call tree which now works for sampling, too, numerous heap walker improvements, and an IDE plugin for eclipse 4.2.
What is new in version 7.1:
- This version adds a JPA/Hibernate probe in the JEE & Probes section.
- In addition, a probe tracker view has been added to all probes that allows you to track selected hot spots and control objects (JDBC connections, sockets, files, processes, etc.).
What is new in version 7.0:
- This releases adds probes for JDBC, JMS, JNDI, servlets, files, sockets, and processes.
- The new CPU request tracking in the call tree view connects call sites and execution sites in parallel and multi-threaded programming.
- Major heap walker improvements include filters in the outgoing references view, toString() display, a new graph view, and inspections.
What is new in version 6.2:
- New profiling mode: Attach JProfiler GUI to running JVMs, also from IDE integrations
- Enable remote profiling for running JVMs with the new jpenable command line utility
- A command line controller for profiled JVMs is provided with the new jpcontroller command line utility
- Improved filter selection in the session settings dialog
Requirements:
- Java SE Runtime Environment
Comments not found