Stockalyze Pro has all capabilities of Stockalyze Lite plus many other useful features like: , Price pattern detection, chart annotations (trend-lines, texts, etc.) , buy/sell signal plotting on chart; Stock Idea Finder based on a Trading System; Back Testing of Trading System using simulated trading on past data; Stockalyze Pro has many built-in Trading System; You can define your own Trading System by using Trading System editor which is based on easy to use graphical user interface. A Trading System is a rule to buy/sell stock and the rule is based on one or more technical indicators. More specifically a Trading system is a set of four rules, each for long-entry, long-exit, short-entry, and short-exit trading positions. Trading System can be used on daily, weekly, monthly, quarterly, or yearly data to find stock ideas, back test on past data of a stock, and plot the buy/sell signal on a chart to visualize when the signal to buy or sell gets generated. To define a new Trading System all you need to do is define rules using GUI. This involves no coding at all. As in Stockalyze Lite Stockalyze Pro has 50+ technical indicators with full capability to configure each and every aspect of a chart.
What is new in this release:
Version 2012:
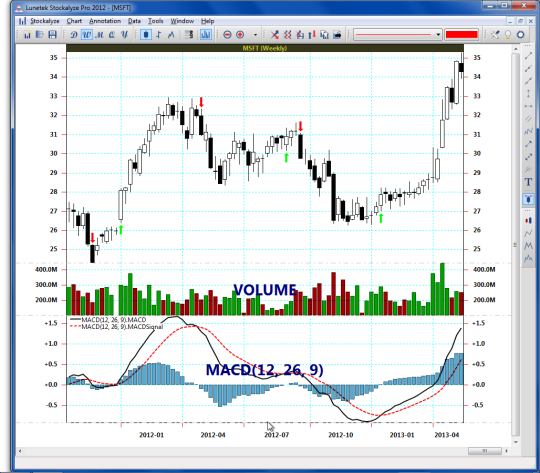
- Candlestick pattern recognition
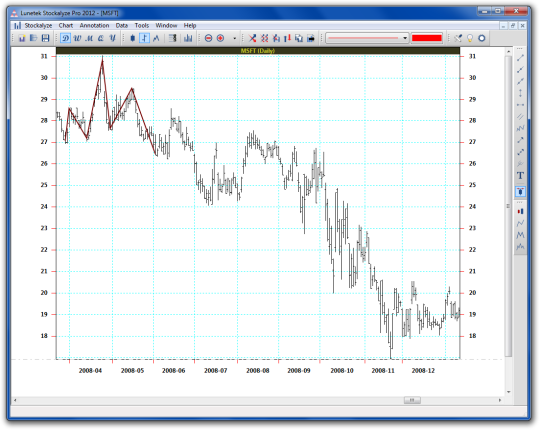
- Price patterns, like head-and-shoulder, double top/bottom recognition
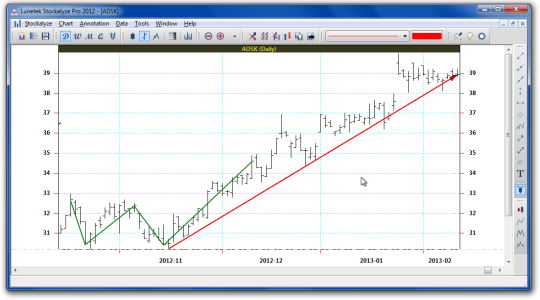
- Ability to annotate chart
Comments not found