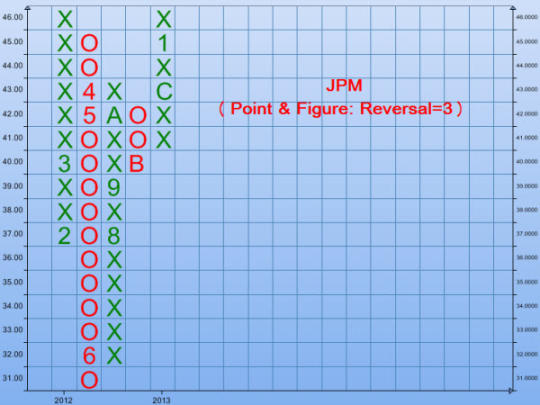
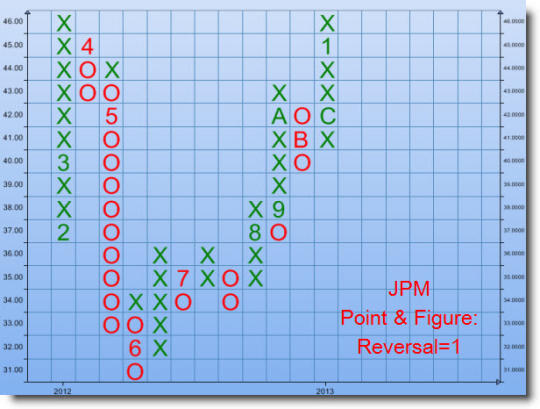
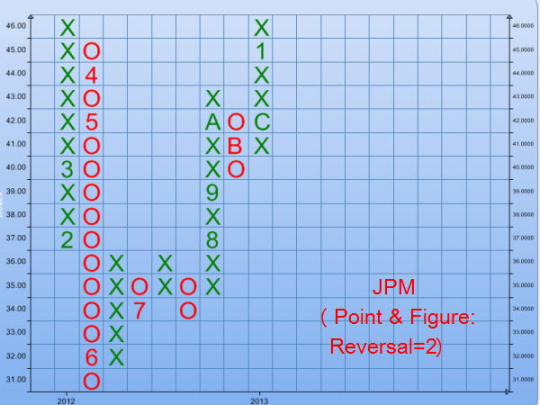
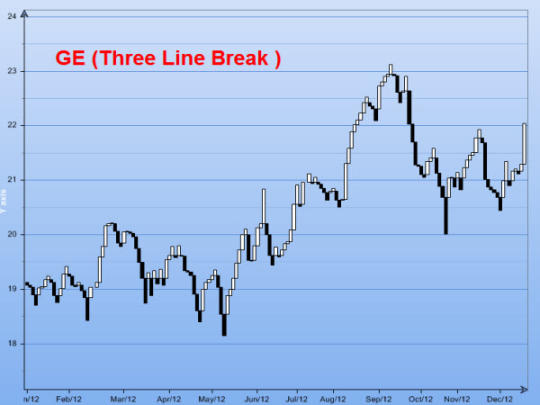
Point & Figure Charts software is an interactive stock analysis tool. It can create various technical indicator charts to help users identify buy-and-sell signals. It takes market stock data from Yahoo,Opentick and data in MetaStock format. It is packaged with a free downloader to download stock data from the Internet. The Premier Feature: Point & Figure Chart is implemented with classic scale ad custom scale. With one click users will get Point & Figure chart with various technical indicators. Key Features: Candlestick, Three Line Break (TLB), KAGI, MACD, stochastic oscillator and Bollinger Band & Envelope. Most frequently used, powerful moving averages: * SMA : Simple Moving Average * EMA : Exponential Moving Average * WMA : Weighted Moving Average * TMA : Triangular moving Average * HMA : Hull Moving Average (new !) * TEMA : Triple Exponential Moving average * LMA : Linear Moving Average * MMA : Modified Moving Average All these moving averages can be calculated on close, open, high, low prices and volume that users can specify in any period . These moving averages can be added on Candlestick chart to identify potential buy-and-sell signals. For the individuals who like Bollinger Band & Envelope, all these moving averages can be added on it too. In addition to the above features, it is also built with popular stochastic indicators. Users can specify %K period, %K slowing period, %D period. With this feature users can study stochastic indicators on any stock price and identify potential buy-and-sell indicators. Another built-in stock indicator is MACD (moving average convergence/divergence). Users can specify any valid, long period, short period, signal period. More details can be found on http://www.numeraltechnology.com
What is new in this release:
Version 2.0.1 includes user interface enhancements, free stock data downloader ehancements, bug fixes.
Requirements:
.NET framework 2.0
Limitations:
30-day free trial. Trial can be extended upon reuqest.
Comments not found