Software Screenshot:
Software Details:
Version: 3.8
Upload Date: 20 Feb 15
Developer: Sergei Chekanov
Distribution Type: Freeware
Downloads: 9
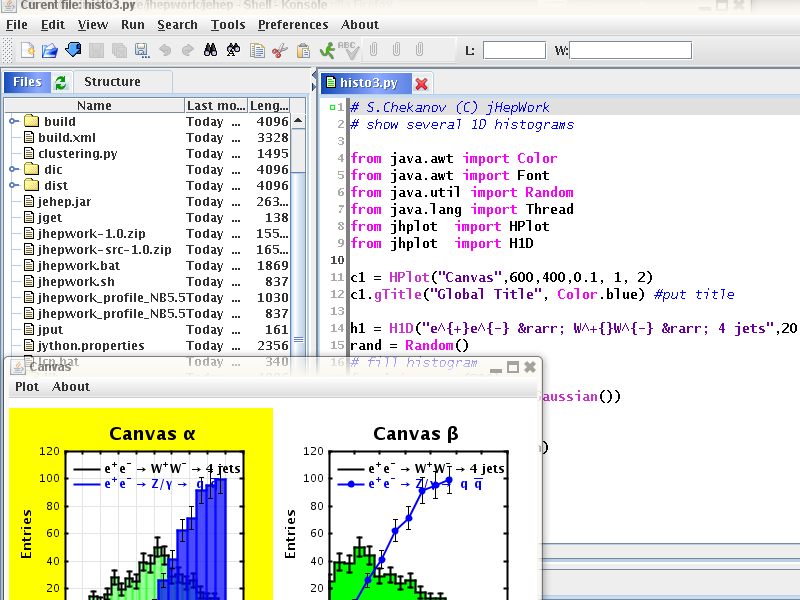
jHepWork is a full-featured cross-platform and open source data-analysis framework written in Java.
jHepWork works on Linux, Mac OS X and Windows, and can do data visualization, data analysis, and scientific computation.
Features:
- Color syntax highlighting
- Multiple clipboards
- Multiple Eclipse-like bookmarks
- File browser
- Multi-document support
- Extensive LaTeX support
- Extensive configurability
- Enhanced console
- Data structures and data manipulation methods
- Extensive configurability
What is new in this release:
- This version adds a tool to convert units and measures [Tools]->[Unit conversion], with examples of how to do the conversions in Java/Jython code. JScience is included as system library.
- HChart plots/charts can be saved to vector format (EPS/PDF/SVG).
- A Plot class for simple plots has been added.
- A spreadsheet has been added to the tool bar [Tool]->[Spreadsheet].
- The HBook class to store all data objects in an XML file has been extended, and XML tags have changed to reflect these changes.
- It was also moved to the hplot.io package. HBook has the same methods to store data as HFile and PFile.
What is new in version 3.7:
- Input and error streams are redirected to an extra tab, "system console". One can disable the auto-update feature.
- A class called "SymRegression" has been added, which can be used to perform symbolic regression.
- Reading and exporting time series and tables in different formats is now supported, including ASCII, Gauss, Matlab, and Excel 97.
- Time series analysis was implemented (PRO version).
- It includes auto-correlation analysis, cross-correlation analysis, peak finder, and Gaussian filtering.
- The toTable() method was reimplemented and added to PND.
What is new in version 3.6:
- Based on version 3.5, but contains auto-updating of separate jar libraries (see the menu [Help]-[Update]).
- jMathLab was moved to v1.2.
What is new in version 3.5:
- All source code was recompiled using Java 7.
- The JMathLab (Octave/Matlab) computational environment was added as a "jMathLab Shell", and about 20 bugs were fixed.
What is new in version 3.4:
- This version corrected H2D classes (fill methods) and the installs.sh script for Macs.
- The JRuby language was integrated along with syntax for the JRuby editor and an integrated JRubyShell.
- Mouse wheel scrolling is now supported in the text area of the IDE. Jython 2.7a2 is supported.
- All system Java system messages are redirected to a pop-up window.
- HChart was rewritten and now has same methods as any other canvases and is supported by the Android version of jHepWork.
What is new in version 3.3:
- This version has a complete rewrite of data collections (speeds up the code by a factor of 3-5 compared to the previous releases).
What is new in version 3.1:
- All FreeHEP libraries are recompiled
- JSci libraries are incorporated
- F1D and F2D functions can be converted to histograms (H1D,H2D).
- isParsed() function is added. F1D function has 2 methods to extract X and Y
- arrays.
- Bug in positions of HLabel, HKey, HMLabel when using log scales
- Positions of HLabel, HKey, HMLabel were corrected when using USER
- coordinated system
- Canvas shows pixel positions (middle mouse click), in addition to USER, NDC
- Fixed positions of Y-labels (spacing for 1, 10 in non-log scales)
- Positions of HLabel, HKey, HMLabel were corrected when using USER
- coordinated system
- HKey class was rewritten. Now you can set key for data (H1D,P1D,F1D) just using these objects as input for HKey construction
- Bug in vectorgraphics was corrected. It is safe to run using Java7 (under
- Linux)
- Bug in setting tic axis for HPlot to a fixed number is fixed
- Labels for ticks can be replaced by custom strings (like time)
- HPlotJa has exactly the same constructors as HPlot.
- New jhplot.utils package. Currently a static class for integration of IJ package with hplot classes for image manipulation.
What is new in version 3.0:
- System.gc() was removed from the clearData() method in HPlot to speed up execution.
- The HChart class has several methods to set fonts. setNameX() and setNameY() were fixed.
- A memory leak in all canvases based on Graph.java was fixed.
- A new version of Protocol Buffers 2.4.1 is now used for jHepWork I/O.
- This will affect several classes from jhplot.io, such as PFile and PEventFile.
- A new Interplator class was added in jhplot.stat.
- This can be used to smooth data using spline and Loess (Lowess) Local Regression Algorithm.
- It can be applied to data P1D and histograms.
- FileRoot from jhplot.io was redone.
- One can navigate inside ROOT files using the standard method cd(dir1/dir).
- The getStat() methods of P1D, H1D, and P0D return a map/dictionary with detailed statistical information for these containers.
What is new in version 2.9:
- Bugs:
- Fixed all bugs in HPlotJa canvas discussed in the thread http://jwork.org/jhepwork/forum/viewtopic.php?id=6
- Fixed a allignment of "0" in the log scale of HPlot
- P0D and P0I cannot be serialized. Using transient for a private class.
- Some improvements:
- P0D, P0I, P1D, PND, PNI data containers have additional "read" methods to read data from URL
- HFile and Serialized method can accept URL file locations
- HPlot3D has white box by default
- HChart: default background is white
- PND container to keep multidimensional data have several methods to project data into 1D, 2D, 3D container for visualisation.
Comments not found