SOFA Statistics is an open source and free graphical software implemented in Python/wxPythhon and designed from the offset as a statistics, analysis and reporting application for your GNU/Linux operating system.
Outputs beautiful and attractive formats
The program is database friendly, spreadsheet friendly, outputs beautiful and attractive formats that can be shared easily, and features automated reporting. Being written in Python, it can be easily used with any GNU/Linux, Microsoft Windows or Mac OS X operating system.
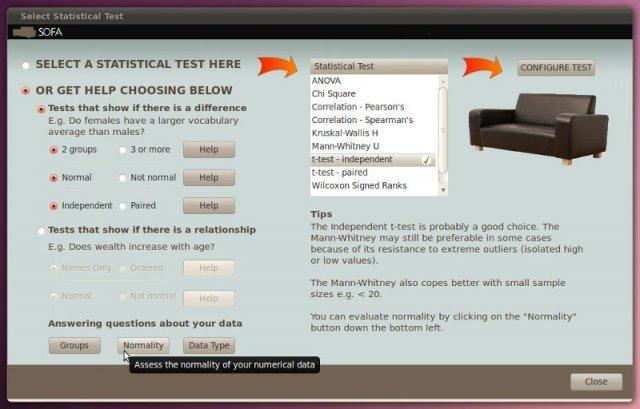
SOFA Statistics lets users create charts, produce attractive report tables, as well as to perform a range of basic statistical tests. SOFA Statistics is the perfect tool for researchers, students, data analysts, and anyone who wants to understand their data.
An application like no other, with a unique interface
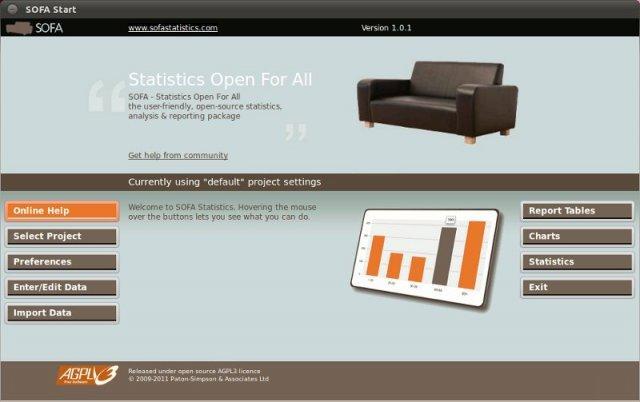
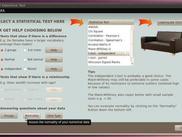
The graphical user interface (GUI) of SOFA Statistics is unique, like nothing you’ve ever seen before. It allows the user to quickly get started with the program by offering step-by-step examples with screenshots.
You will be able to enter data into a fresh data table or select an existing table to edit or add data to. For tables in the SOFA database, you will be able to rename data tables, add, delete or rename fields, change the datatype of fields, as well as to recode values from one field into another.
From the “Import Data” button, you will be able to import data, such as a spreadsheet (Google Docs, Excel, Open Document) or CSV file. In order to connect to a database, you must click on the “Select Project” button and configure the connection settings.
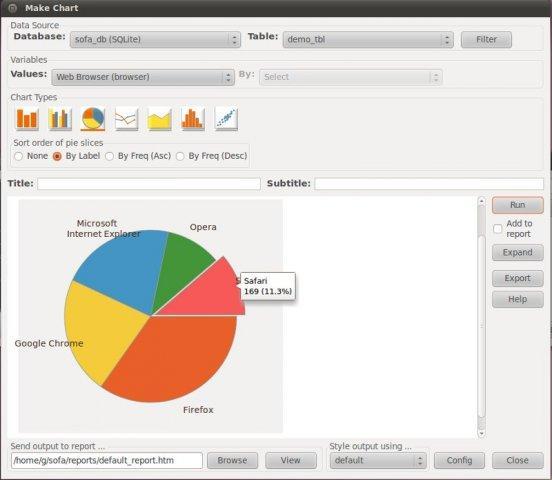
The Report Tables functionality allows you to make report tables, such as Gender vs Age. It is possible to create simple Crosstabs, Frequency Tables, Row Stats Tables, as well as simple lists of data. In addition, you can create attractive charts with dynamic visual effects.
What is new in this release:
- SOFA line charts and area charts now treat dates as dates in the x-axis which makes it easier to look at time series data.
- Additional improvements include:
- Better error message when not enough values in group to run analysis e.g. ANOVA.
- Better handling of precision in p-value results displayed.
- Better handling of dates pre-1900.
- Better messages to user about potentially excessive categories in charts.
- Add support for float years as date values for time series.
- Add support for specifying port connecting to postgresql.
- Allows boxplots when fewer values to display.
- And there were two other changes:
- Removed broken google docs integration - just as easy to manually download and import normally.
- Removed two pop-ups - no longer needed.
- There are also a number of bug fixes:
- No longer a missing legend in multiseries scatterplots just because the first scatterplot only had one series of data.
- Fixed bug with saving database connection details when a number involved (port).
- Fixed PostgreSQL bug when saving connection without password - now succeeds rather than failing silently.
- Fixed MySQL bug with adding rows.
- Fixed bug in Windows with checkboxes not enabling/disabling properly unless panels refreshed.
What is new in version 1.4.5:
- Box plots can be displayed with different outlier and whisker display options.
- ODS importing can now cope with repeated column names.
- Better error message when unable to get regression line details because of limited variability.
What is new in version 1.4.4:
- Mac users can export output in PDF format (and PNG depending on version of OS X).
- Added new monochrome theme.
- Chi Square proportions output much easier to interpret successfully.
- The name of the grouping variable is now displayed when running comparisons of groups e.g. Country if comparing Italy and Germany.
- Exporting to spreadsheet detects if too many fields for xls output and informs user that only csv will be generated. Also truncates table name so worksheet name not too long.
- Import dialog only displays file types suitable for importing.
- Added message to let user know spreadsheet creation being skipped if no report tables to export.
- More user help on need for raw data (not pre-summarised) and long-format vs wide-format data as appropriate.
- Code reorganisation to make it possible for SOFA to be called in GUI form by external code GUI code.
- Scripts are now easier to use for standalone purposes.
- Added note about treatment of datetime data as categorical by SOFA for purposes of statistical tests.
- When exporting to spreadsheet and csv changes reserved sofa_id field name to was_sofa_id so it is OK to reimport after changes.
- More informative for larger range of potential problem e.g. database engine not functioning.
What is new in version 1.4.3:
- Can import tab-delimited data.
- More options for attractive charts and reports. Three new themes available - sky, prestige (screen), and prestige (print).
- Better support for automation (i.e. headless, running without GUI) esp in international context.
- Exporting to spreadsheet now relies on more robust code library (xlwt)
- Easy to select or deselect lots of row stats measures at once.
- Faster opening in many cases.
- And the bug fixes:
- Minor tweak to PostgreSQL plug-in to handle timestamps without timezone.
- Resolved bug when SQLite numbers are stored in a non-numeric field and processed for Chi Square test.
- Importing csvs now copes better when only missing vals in sample of a field. Gives user the choice.
- Fixed bug when doing a Row Stats table with a rows variable e.g. by Gender and some of the fields can't be calculated for some of the row categories.
- Headless importing now works in the event of inconsistent data types in fields.
- Headless importing now reads entire dataset rather than a sample to avoid need for (human) decisions.
- Scripts no longer rely on translated arguments. Much safer to use on other machines with different locales.
- Fixed circular import bugs which only became visible when other bugs occurred.
What is new in version 1.4.2:
- Can export results as high-resolution images (PNG), PDFs, and tabular output as spreadsheets without needing plug-in extension (doesn't work for Macs currently - very sorry :-( ).
- Can export data tables to spreadsheet without needing plug-in extension.
- Can backup SOFA data and settings without needing plug-in extension.
- Variable details content (vdt files) is now sorted which makes it much easier to read and search for items when checking things.
What is new in version 1.4.1:
- Scatterplots now have option of displaying regression line with slope and intercept details.
- Export output plug-in (proprietary add-on) now gives option of exporting tabular data to spreadsheet.
- Better positioning of legend in scatterplots made by matplotlib.
- Tweaked algorithm for getting optimal min and max axis values so more sensible when no variation.
What is new in version 1.4.0:
- Ease of use is one of SOFA's main goals (along with "learn as you go", and "beautiful output"). Unfortunately, as new options were added to SOFA for exporting data, the simplicity of the output section of the user interface suffered slightly. New buttons were squeezed in one by one and the interface was getting more and more crowded. Something was going to have to change. And in version 1.4.0 it finally has! - I hope you like the change. It not only removes two interface items but it also adds room for more export options in the future. And there is more horizontal space in the drop-down control to describe each option more clearly and distinctly.
What is new in version 1.3.5:
- Bug fixes:
- Fixed bug in histogram output when limited data spread. Error caused by miscalculation of significant decimal points required for display.
- Fixed bug stopping late-added title details appearing when exporting output. The demo output is refreshed first so the source file is forced to be up-to-date. Probably needs a proper tidy-up some day but this works well in the mean time.
- Fixed bug in exporting to desktop folder in fix_pdf - need to strip end off folder name when no AM/PM under localisation used.
- Fixed various bugs associated with exporting output. When copying output, message about keeping form open now names form it means (to reduce confusion).
- Fixed bug when using a project after it has just been deleted (by pressing cancel in select projects dialog after having deleted the currently active project).
- Fixed bug which meant "Show Results" and "Add to report" options were displayed when setting up a project.
- Fixed bug when cancelling a variable details selection in a project.
What is new in version 1.3.4:
- Can make more complex charts and larger series of charts. It is now possible to override the conservative limits on charts e.g. the maximum number of series or charts or clusters. A warning is shown that you may not necessarily produce a viable chart or set of charts. But often it will work so now you get to try and see.
- Importing now copes with excessively long fieldnames by shortening them automatically (without risking duplicates).
- MS SQL Server views can now be analysed, not just tables.
What is new in version 1.3.3:
- Improved statistics output footnotes.
- Borders on bar-type charts are now optional. This can be useful when bars are very short.
- Chi square clustered bar charts can cope with higher default limits for number of values.
- Importing field names with more than 90 characters prohibited at the point of import rather than causing problems later.
- The group by max number of values is now controlled by a single my_globals setting (making it easier to override).
- The default settings for some remaining max values have been increased.
What is new in version 1.3.2:
- Can backup SOFA data, reports, and variable and project details, via extension plug-in.
What is new in version 1.3.1:
- Adding sum as an option for charting e.g. a line chart showing total income per month by product.
- Matplotlib scatterplots now have optimal min and max settings calculated for their x-axis.
- Added footnote to Wilcoxon output explaining that different statistics packages may report the test statistic differently.
- Misc fixes to chart layout including left margin offset.
- Easier to add new variable definition files from within dialog for choosing them.
- Modified recode column labels and help content to reduce confusion about which columns to enter range information into.
Requirements:
- Python

Comments not found