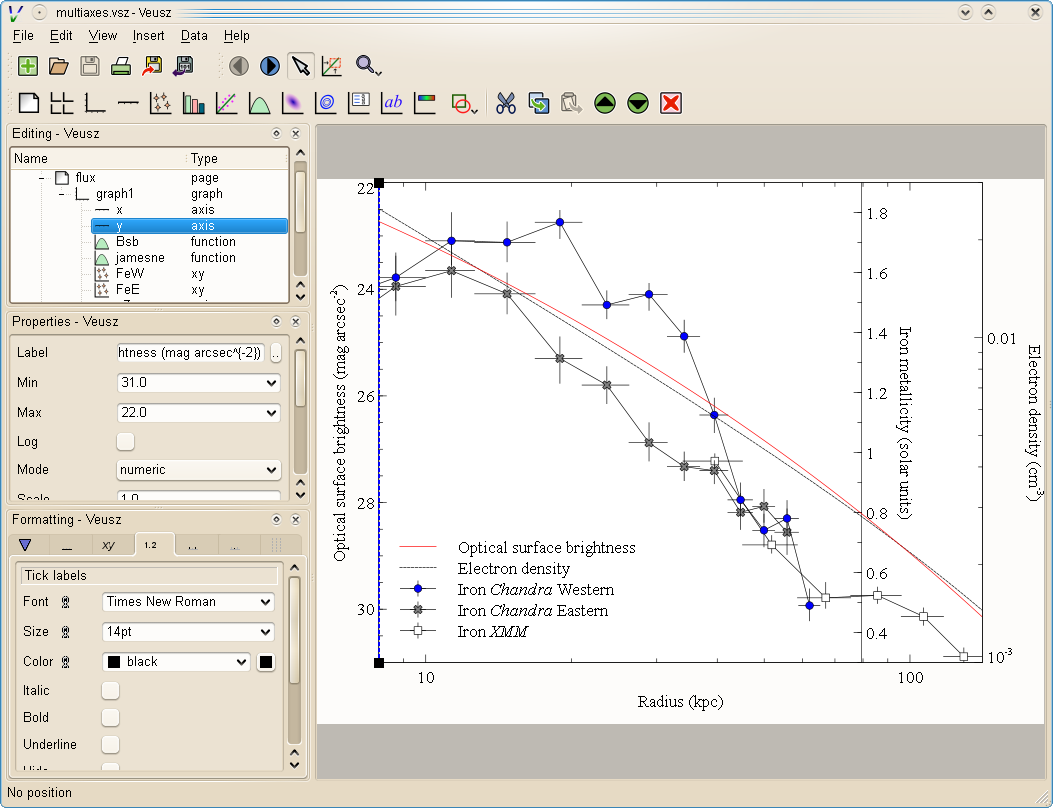
Veusz is an open source and cross-platform software project that provides users with a unique and complex scientific plotting application, specifically designed to allow users to create PDF and Postscript output that is ready for publishing.
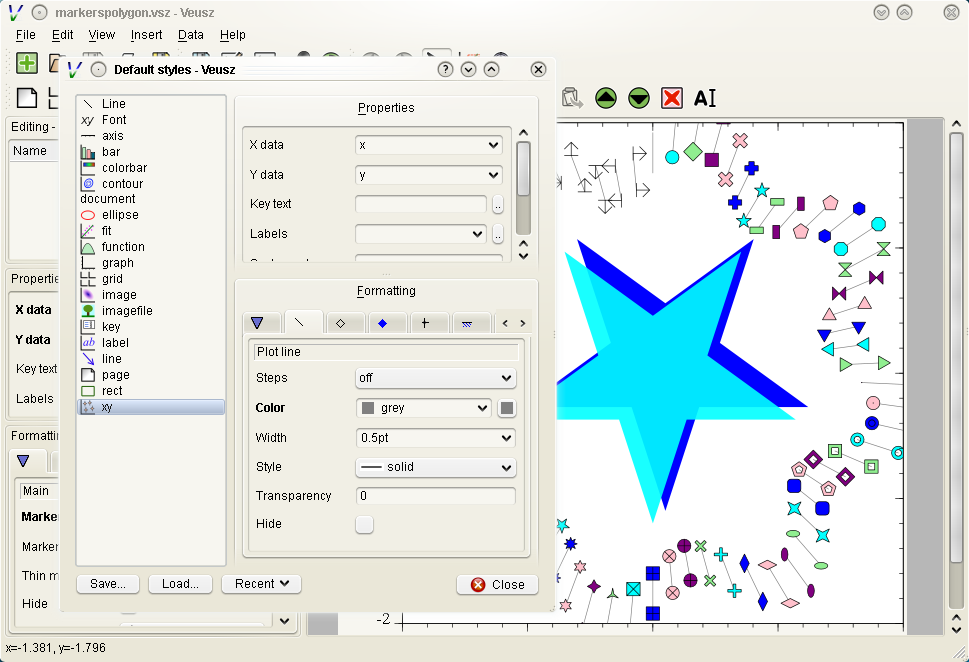
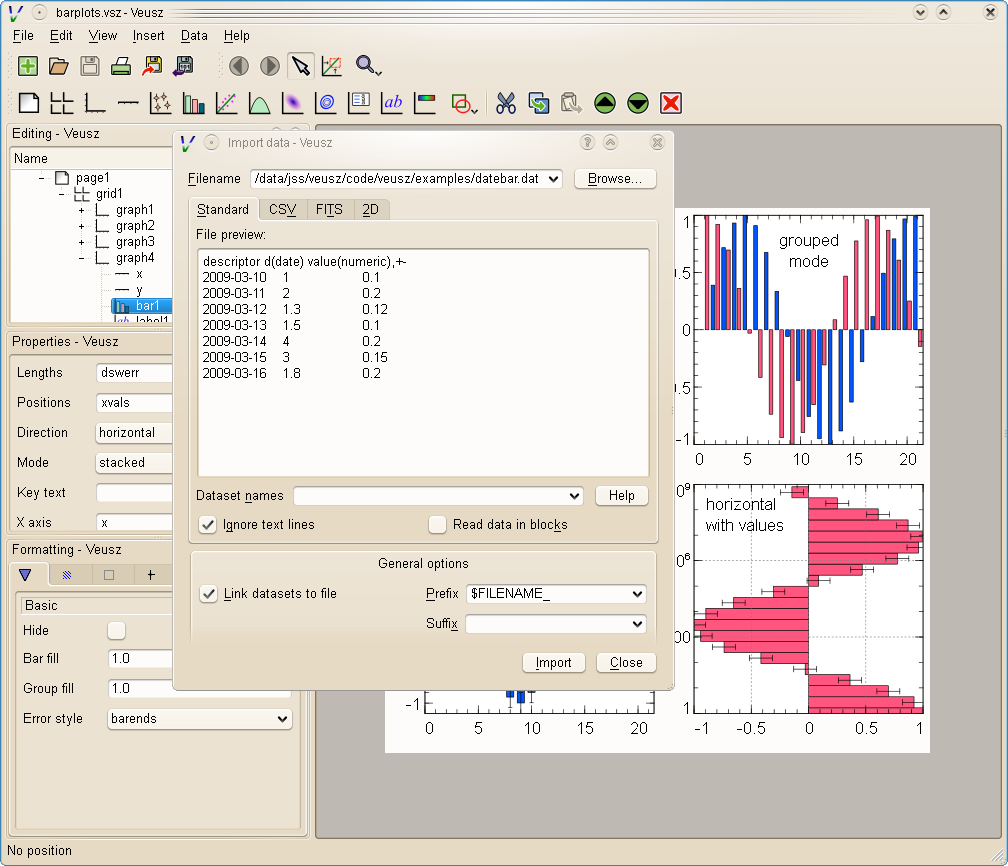
Key features include the ability to create line graphs, images, histograms, XY plots, box plots, shapes, polar plots, ternary plots, contour plots, and vector field plots, three user interfaces (graphical, CLI and scripting), as well as the ability to design complex layouts.
It can export the output to EPS, PDF, PNG, SVG, Bitmap and EMF file formats, read data from Plain Text, CSV, FITS, QDP, NPZ/NPY, HDF5, user-plugin and binary files, create plotting widgets with a constant object-based interface, and act as a Python plotting module.
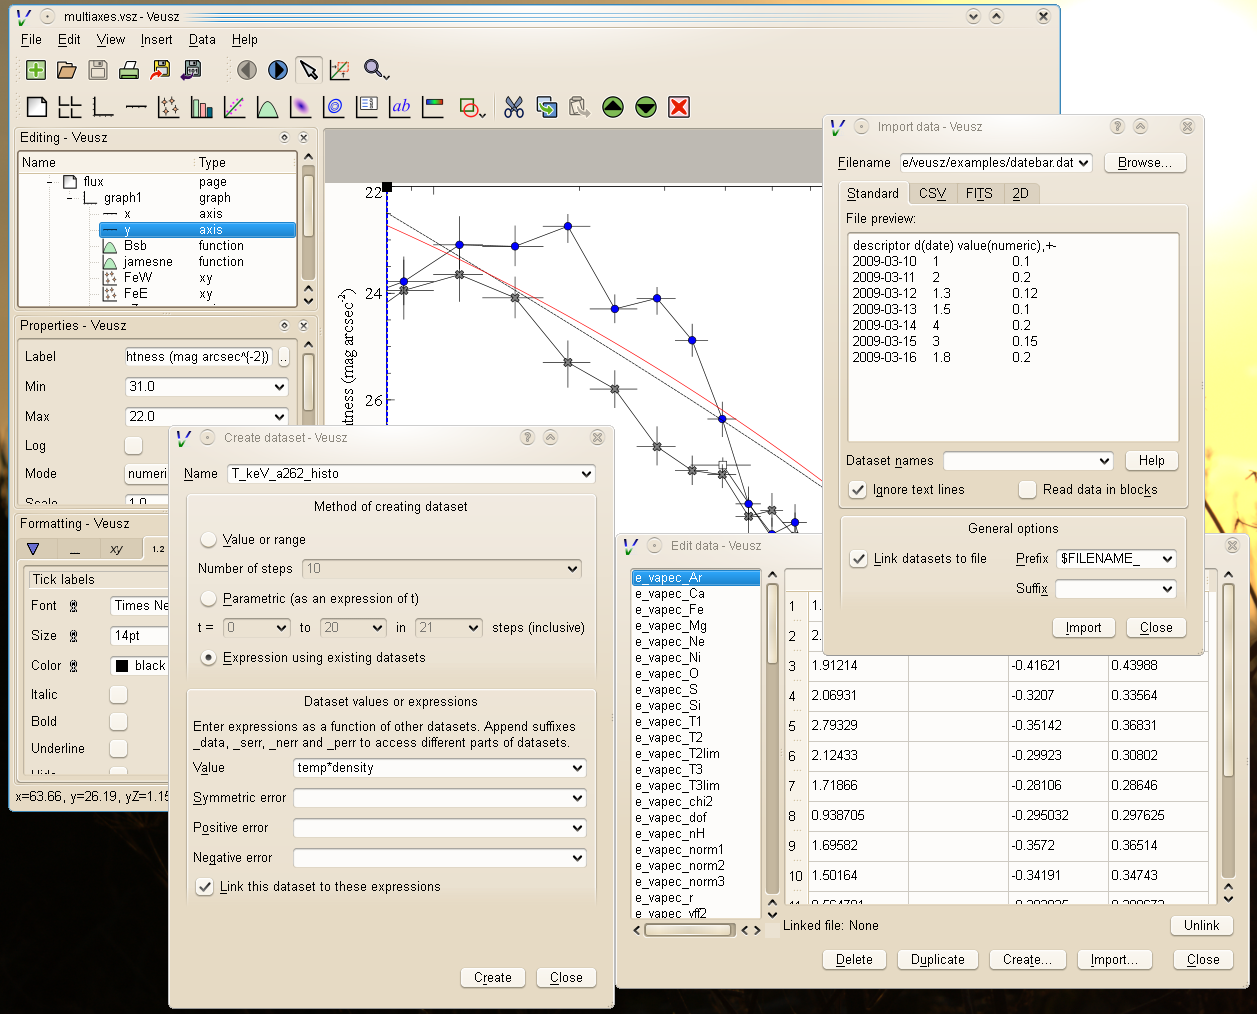
In addition, the application is capable of manipulating and creating datasets, capture data from external sources, create a new dataset that is linked to an existing dataset, import data in new formats, and import external Python functions.
Another interesting feature is the ability to embed the application within other programs, which will allow them to use its powerful plotting features listed above. Furthermore, it supports user defined functions and constants.
Among other interesting features, we can mention support for multithreaded rendering, a data picker utility, plugin architecture, control with SAMP and D-Bus, as well as an interactive tutorial that will appear when you start the application for the first time.
Under the hood, we can report that the application is written in the Python programming language and uses the PyQt/Qt4 libraries for the graphical user interface, and the Numpy library for the scientific plotting functionality. It supports GNU/Linux, Microsoft Windows and Mac OS X operating systems.
Summing up, Veusz is a great and complex scientific plotting application that has been designed from the ground up to provide users with top-notch features and unique functionality.
What is new in this release:
New in Veusz 1.23.2 (January 4th, 2016)
What is new in version 1.23.2:
- Add data clipping dataset plugin
- Fix boxplot with manual settings
- Fix plugin normalize and divide by maximum for new numpy versions
- Avoid error in 2d data creation
- Fix problems with unicode characters in plugins in Python 2.x
- Clip axis to sensible range -1e100->1e100
- Handle unicode errors from operating system in Veusz scripts
- Handle unicode errors in error reports
- Fix crash in \color
What is new in version 1.23:
- Add new export dialog box which can export multiple pages and modify the export options
- Add new dataset filtering dialog
- Add cubehelix() functional colormap
- Add -stepN suffix for colormaps to make arbitrary numbers of steps
- Fix incorrect colors in log images and log color scales
- Fix unsafe commands not being run
- Minor changes:
- Fix incorrect use of None in (x,...) pattern
- Catch crash if plotting nan/inf value in log space
- Fix getData in dataset plugin for dimensions=2
- Catch error in too large float to date time conversion
- Catch disappeared file during import
- Index error fixed in pickable
- Catch error in data edit dialog if 2d dataset size changes
- If root widget is selected with others, do not error on hide
- Fix undo for dataset histogram with a single output dataset
- Fix error resizing ellipse with a tuple width, height or position setting
- Only use finite values in histogram
- Rewrite Line/FillSet setting controls for internal consistency and to fix new style extended fills
- Do not crash with log date-time axes
- Also ignore non-finite values when fitting with minuit
- Avoid syntax error with invalid colormap
- Updates to setup.py and desktop files
- Recreate dataset now works if dialog hasn't been opened already
- Restore dock layout when using Python3
- Fix undo after loading stylesheet/custom definitions
- Support unicode example filenames
- Clip bezier lines to avoid problems with log axes
What is new in version 1.22:
- Add option to ignore white space following delimiters when importing CSVs
- Allow x/yedge and x/ycent to be inverted to change data order when import 2D data
- Rewrite of widget tree internals to fix miscellaneous bugs
- Optionally use astropy for SAMP
- Add setting to extend the python import path
- Add option to select widgets with same name on page
- Resize rectangular shapes keeping other corners fixed. Old symmetric resize behaviour is retained if shift is pressed.
What is new in version 1.21.1:
- Changes:
- Add swap option on keys, swapping symbol and text
- Bug fixes:
- Fix missing labels if colorbar out of plot
- Preserve tags when reloading datasets
- Handle nan/inf/-inf when as value in UI
- Remove dependence on pyqtconfig in build system
- Handle errors properly in 2D CSV read
- Do not crash if selecting siblings of document widget
- Fix accidental modification of data by line widget
- Improve PDF bounding box rounding to prevent chopping near edge
- Fix function plotter in embedding
- Fix astropy version checking
- Fix crash for error bar in CSV with blank previous column
- Features of package:
- Plotting features:
- X-Y plots (with errorbars)
- Line and function plots
- Contour plots
- Images (with colour mappings and colorbars)
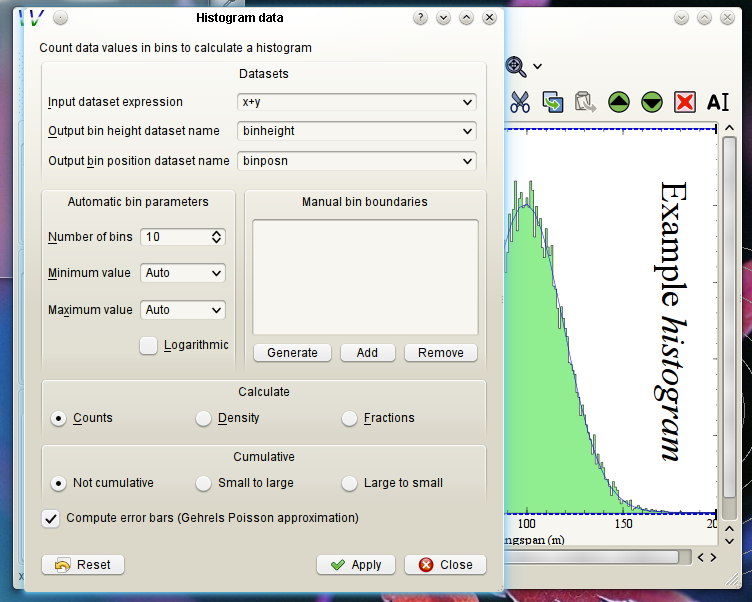
- Stepped plots (for histograms)
- Bar graphs
- Vector field plots
- Box plots
- Polar plots
- Ternary plots
- Plotting dates
- Fitting functions to data
- Stacked plots and arrays of plots
- Nested plots
- Plot keys
- Plot labels
- Shapes and arrows on plots
- LaTeX-like formatting for text
- Multiple axes
- Axes with steps in axis scale (broken axes)
- Axis scales using functional forms
- Plotting functions of datasets
- Input and output:
- EPS/PDF/PNG/SVG/EMF export
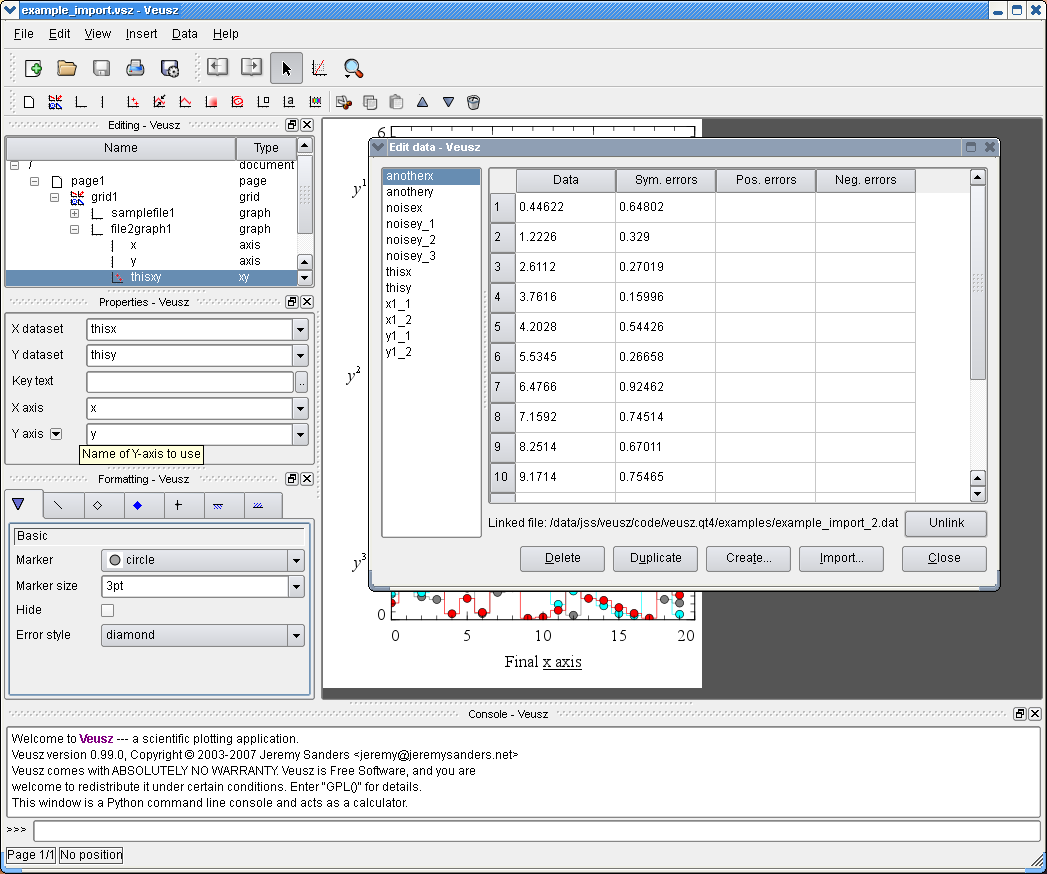
- Dataset creation/manipulation
- Embed Veusz within other programs
- Text, HDF5, CSV, FITS, NPY/NPZ, QDP, binary and user-plugin importing
- Data can be captured from external sources
- Extending:
- Use as a Python module
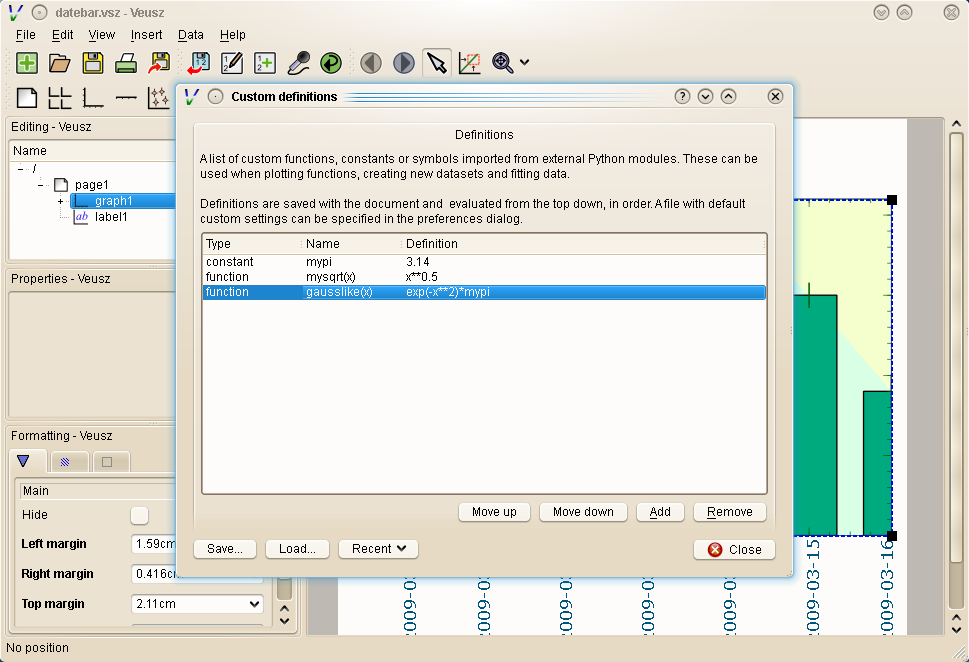
- User defined functions, constants and can import external Python functions
- Plugin interface to allow user to write or load code to
- import data using new formats
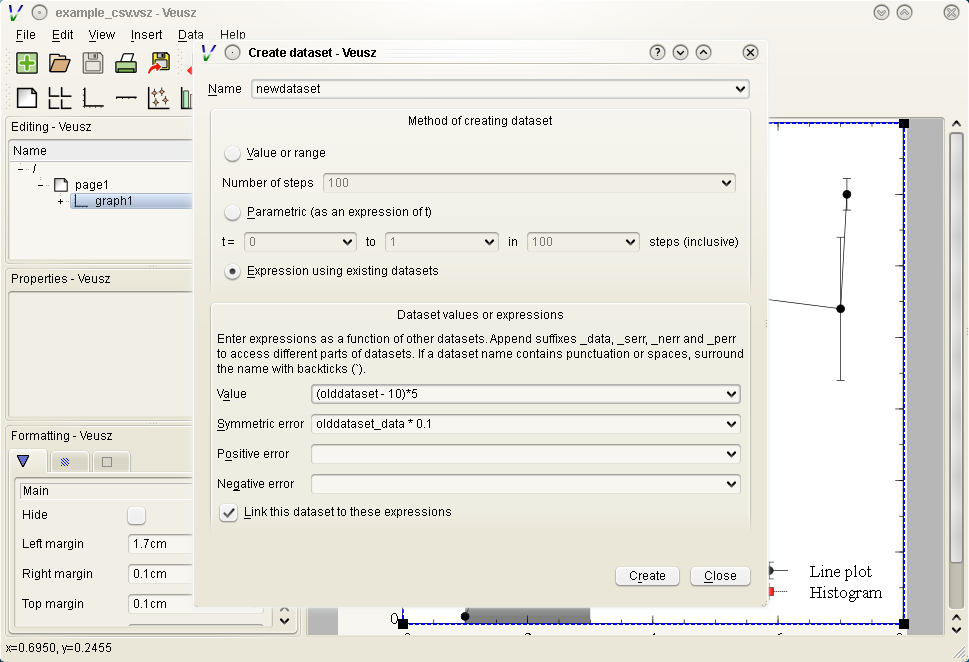
- make new datasets, optionally linked to existing datasets
- arbitrarily manipulate the document
- Scripting interface
- Control with DBUS and SAMP
- Other features:
- Data picker
- Interactive tutorial
- Multithreaded rendering
What is new in version 1.21:
- Add HDF5 saved document format
- Add filled curve error bar style
- Add fill left/right options for point plotter
- Add filetype filters to import dialog file browser dialog
- In file completer in import dialog, use selected tab as filter
- Move code to use PyQt new style signals
- Add a master color setting for xy point and nonorthpoint plot
- Line labelling algorithm much improved in contour plots, which rotates text to match line angle and avoids label overlaps
- More accurate axis tick label bounding boxes, allowing rotated labels to be placed close together
- Add reflection and rotation options to vector field widget
- Switch to scientific notation earlier when showing float settings
- Bug fixes:
- Direction combo did not work in import dialog
- Saving text datasets did not work in Python3
- Fix partial dataset evaluation issue when loading documents
- 2D non-regular pixel spaced images give error if clipped in y
- Handle Unicode quoted characters in simple text data files
- xcent/ycent in Dataset2D import plugins were ignored
- promote_tab broken for import plugins
- Full screen view when all pages are deleted
- Crash with empty dataset and boxplot widget
- Fix copy and paste of datasets
- Python 3 resizing axis bug
- Crash if picking/zooming on document with no pages
- Crash if reediting histogram dataset with blank output entry
- Use end of text formatting string beyond format specifier
- When writing SVG text as text, use xml:space="preserve" to avoid missing whitespace
- Embedding socket issue on Python 3.4+
What is new in version 1.20.1:
- Changes in 1.20.1:
- Include free-desktop appdata, MIME and desktop files
- When plotting xy widget filled error regions, plot line on top
- Bug fixes:
- Fix embedding interface startup problem in 1.20
- Additional embedding interface fixes for Python 3
- Fix crash in tutorial if flashing widget deleted
- Fix polar plot crash with reverse minumum and maximum radii
- Fix crash when changing range of broken axes interactively
- Fix object deletion crash in setting menu
- Check output dataset is not same as an input for histograms
- Fix for compilation on Qt 4.6
- Catch socket errors on embed client
- Fixes for formatting strings, including fixes for arguments of the extended %Vg format and properly supporting %%
- When restoring window position, do not restore offscreen
What is new in version 1.20:
- Add HDF5 file data import
- Allow expressions to be edited for linked 2D datasets
- Add support for 2D datasets with irregular gridpoints
- Add 2D data CSV import
- Allow safe renaming of linked datasets
- Support importing text from FITS files
What is new in version 1.19.1:
- Add option to disable scaling of marker border with point scaling
- Implement label at-minimum/at-maximum for ternary plot
- Add border and background fill settings for text label widget
- Enable FITS support with astropy
What is new in version 1.19:
- Make code compatible with python3
- Separation of python module and resources in source package (packagers may need to consult INSTALL)
- Move to v2 of PyQt API
- Remove deprecated numpy API from helpers module
- Allow FITS dataset names to be blank if prefix/suffix are not
- New ast-based code security checker
- Picker uses 1-based index for consistency
- Allow non-text datasets to be used for labels
- Add number->text conversion dataset plugin
- Add binning dataset plugin
- Add notes properties to document, pages and graphs
- Allow more significant figures in float values
- Intelligent choice of significant figures when interactively changing axis range
- Decrease minimum range of axis
- Add notes setting to document, pages and graphs
- Bug fixes:
- Fix crash if other linked axis not initialized
- Fix crash if trying to edit non-editable datasets
- Make ignore exception work in error reporting dialog
- Renaming datasets, widgets and editing data now allow original text to be edited, rather than being cleared
- Fix line positions on broken axes
- OS X Mavericks - fixes for opening files from finder and fonts
What is new in version 1.18:
- Add support for dataset expressions when plotting
- Add axis-function widget for plotting axes which have a scale given by a function, or are linked to a different axis via a function
- Add stepped colour maps
- Support editing multiple datasets simultaneously in editor
- Add setting to fix aspect-ratio of graphs
- Add 'vcentre' line step mode for vertical step plots
- Add internal margin setting for grids to separate sub-plots
- Add pixel, pixel_wcs, fraction and linear_wcs FITS import coordinate system modes
- Add drop down toolbar button menu to create axis widgets
- More efficient widget dependency resolution
- Bug fixes:
- Fix reversed 'broken'-axes
- Do not always draw axes above other widgets (fixes problem with key below axis)
- Fix use of transparency image when plotting non-square images
- Allow lists passed as xrange and yrange to create 2D dataset
- Fix FieldBool positioning for plugins
- QDP import: fix "no" values when used mixed with numbers
- Remove warning of log images with zeros
- For embedded mode, always return string for __repr__
- Workaround for windows appearing behind for Mac OS X
- Improve property spacing on Mac OS X
What is new in version 1.17.1:
- Allow coloured points for non-orthogonal plots (polar, ternary)
- Remove unnecessary exception data
Requirements:
- Python
- PyQt
- Qt
Comments not found