Software Screenshot:
Software Details:
Version: 2.18
Upload Date: 17 Feb 15
Developer: The DHIS 2 Team
Distribution Type: Freeware
Downloads: 1666
DHIS 2 (District Health Information Software) is an open source, flexible, platform-independent and free web-based software that can be used to collect, analyze, validate and present aggregated (statistical) data. It’s a modular information system based on free and open source Java frameworks, such as Spring, Hibernate and WebWork.
Features at a glance
The software can be used to capture data on any type of device, including laptops, desktops, tablets, smartphones and other devices. It provides a wide range of solutions based on Java, SMS and HTML5, which work offline to improve reach in locations with poor connectivity.In addition, it features superb visualization features, such as Geographic Information Systems (GIS), pivot tables and charts. Offers an application for capturing and reporting events, tracks entities, access control and data approval tools, top menu system, support for OpenID authentication, user account invites and extended sharing.
The world's most used health information system
DHIS 2 is dubbed by its developers as the world’s most popular free health information system, as it is being used by numerous organisations and health institutions across five continents in over 45 countries.It is interoperable, featuring its own DXF 2 file format and SDMX-HD standard, specially designed for data exchange and metadata. A REST-based Web API will give developers instant access to most parts of the project.
A highly scalable information system
Another interesting feature is the ability to be support hundreds of millions of data records and thousands of concurrent users using only a single web server. Please keep in mind that the software is heavily used as the national health information system in a wide range of countries.Under the hood and supported operating system
The program is written entirely in the Java programming language, designed to run on the cloud, which means that it is platform-independent. All you need to use DHIS 2 is a modern web browser that supports JavaScript.What is new in this release:
- Interactive items: The map items let you zoom in or out and drill down/float up between layers. Click on series in charts to hide or show them. Hover over maps and charts to see data values and details.
- Google maps: The map dashboard items now use Google maps as background layer.
- Re-size items: You can re-size items and switch between normal, double and full width by clicking on the "resize" link on the item headers.
- Event reports: You can now include event reports in your dashboard.
- Smarter search: Search by words independently to find favorites more easily, e.g. "ANC district".
- More features: Support for pivots with legend sets, facility map layers and radius for map points.
- Better looks: The dashboard items are rendered using the pivot table, data visualizer and GIS components which give a better visual appearance.
- Simpler configuration and loading of apps: Apps are now loaded by default through the Web API without any need for configuration. The benefit is that you can upgrade your DHIS 2 version without affecting already installed apps. The app configuration can be set through the apps Web API resource.
- Managed users: A new "managed users" concept for user management has been introduced. This allows you to explicitly define which users are allowed to modify which users. This is done by defining users groups to manage other user groups through the standard user interface. To enable this you should grant users the authority to "Add/update users within managed groups" instead of the normal "Add/update users".
- Replication of users: New feature for creating an identical copy of a user, with a new username and password. Replicating accounts is useful when working with support requests related to access control. Select a user in from the user list, select replicate and enter new credentials.
- Tracker enrollment history: In tracker capture dashboard you can now list historical enrollments by clicking on "History" and view captured data for each of them. Notes can be added to historical events.
- Easy enrollment for relatives: A program can be configured to present shortcuts for relatives, which now can be easily enrolled into a specified program. As an example, for a "mother and child" program you can now specify that the child should be added into a "immunization" program. This will make the "immunization" pre-selected in relationship dialog.
- Favorite names in dialogs: In all analysis apps you can see the name of the current favorite in the header of the favorite and share dialogs. This makes it simpler to see which favorite you are working on e.g. when updating favorites.
- CORS support: DHIS 2 now supports Cross-origin resource sharing (CORS), which is a mechanism that allows resources to be requested from another domain. This means most notably that you can make requests to the DHIS 2 Web API from a web page or portal living on another domain than the DHIS 2 instance. The domains which should be allowed access must be defined under system settings > remote access.
- See apps authorities: We have added authorities for seeing apps so that you can control per user roles who should be allowed to access which apps from the top menu.
- Clear local storage app: A new app has been added for clearing the application storage, which is the area where DHIS 2 stores data locally in the web browser. This is sometimes tricky to clear and web browsers have different menu layout for doing it, so an app is useful e.g. when doing user support.
- Attributes for program: Dynamic meta-data attributes can now be defined for programs from data administration > attributes.
- Remove expired invitations: A new maintenance function has been added under data administration > maintenance for deleting users which represent user account invitations which now have expired. This is useful when you send out a lot of user invitations and need to clean up after some time.
- Infrastructural indicator data in GIS: You can configure an indicator group as "infrastructural" under general system settings, which will subsequently show up with indicator data in a dialog when left-clicking on an area or point in GIS.
- Instant validation in event capture: In event capture, you will now get instant feedback if you type values of the wrong type in input fields.
- Multiple message "mark for follow-up": You can now mark multiple messages for follow-up in one go under messages.
- Data set sections in context menu: Form sections are now accessed by clicking on data sets to open the context menu. This allows for faster navigation.
- Web API features:
- PDF, Excel, CSV support for meta-data: You can now get lists of meta-data as PDF, Excel and CSV files directly from the Web API through the normal ".pdf", ".xls" and ".csv" URL extensions or through accept headers.
- New filters: The meta-data filter function now supports startsWith, endsWith, nlike (not like), which allows for greater flexibility when filtering meta-data.
- Email: A resource for sending emails for system notifications and testing has been added. This is useful e.g. when you have developed external scripts that need to send email messages to the system administrators. Requires that an email SMTP server has been configured.
- PATCH support: You can now do PATCH requests in order to do partial updates of meta-data. You can e.g. update only the name of a user group. This is useful to avoid sending very large payloads just to make a change to a simple property.
- Better user query: The user query function has been made more flexible and allows for querying for users that can be managed by the current user, last login, inactivity, self registration, invitation status and more.
- Import strategy for tracker data: You can now define whether to only create or create and update entities when importing tracked entity instances, enrollments and events.
What is new in version 2.14:
- Mapping of events
- Data approval
- Data set categories
- Dynamic person attributes only
- Embed code for plugins
- Context menu
- Google analytics support
- Pivot table sorting
- Forced password change
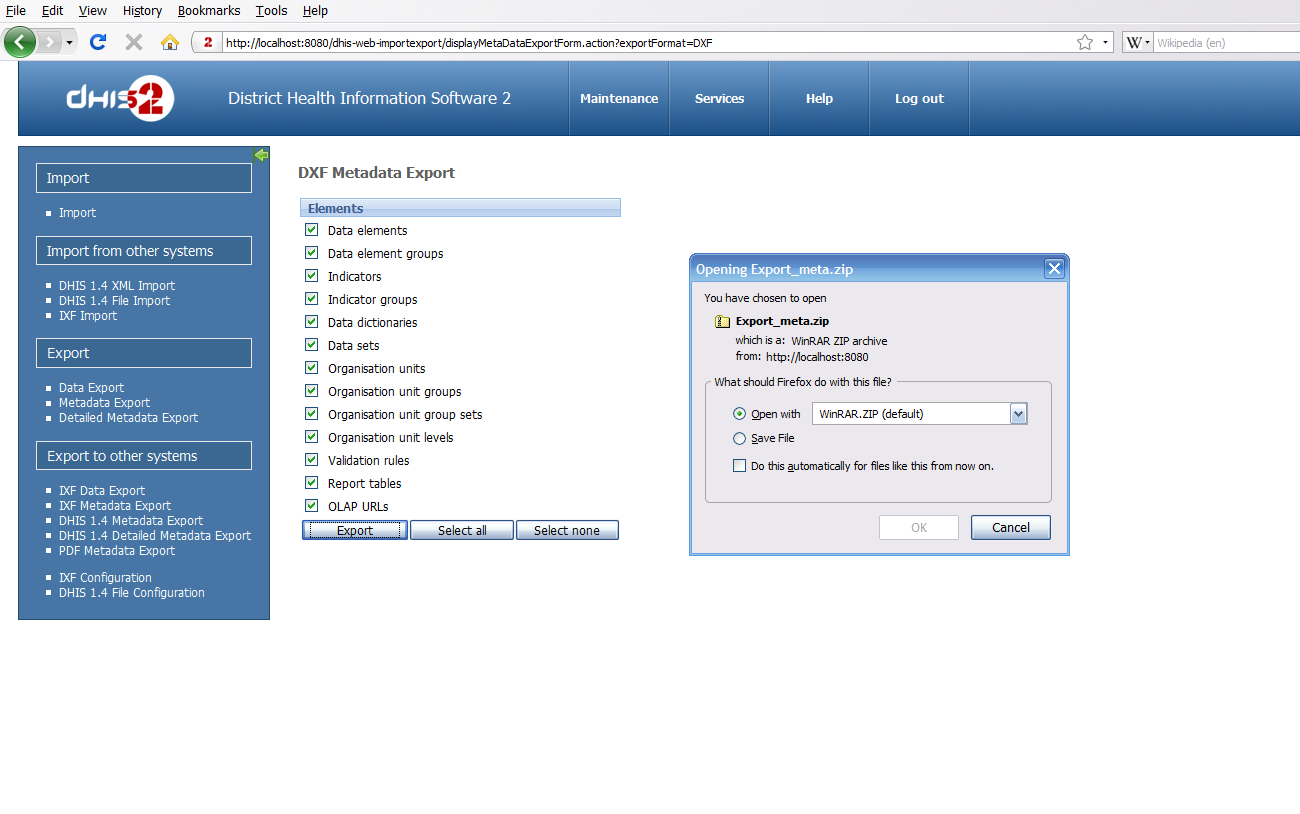
- Detailed meta-data export
What is new in version 2.13:
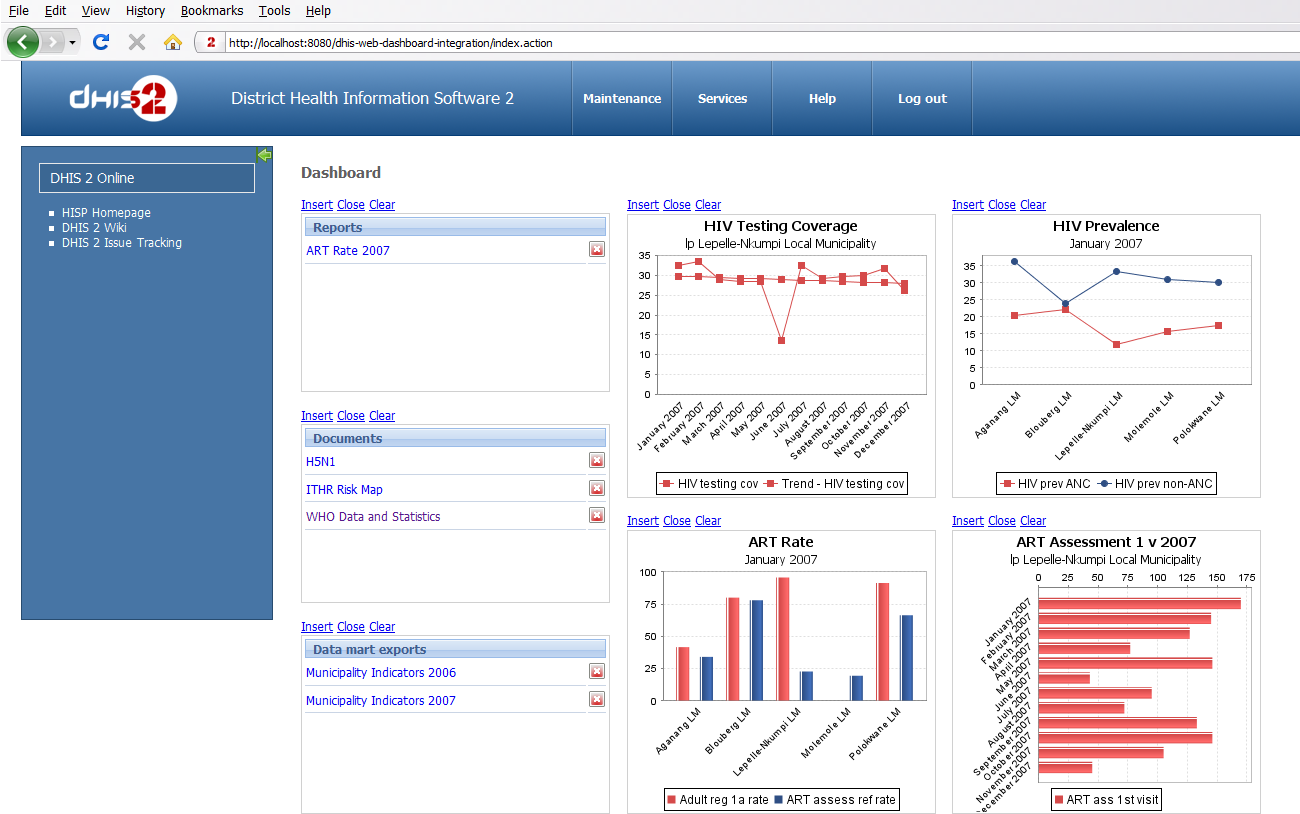
- Dashboard with search:
- Use the search area at the top to look for and include maps, charts, pivot tables, users, reports by clicking on "Add" in the search result. You can now have any number of personal dashboards - for instance can create one for each subject you find interesting and easily switch between them. You can put any number of items on each dashboard and drag-and-drop to arrange them in your preferred order. Maps and pivot tables can now be embedded directly. Dashboards can be shared with other users or group of users, just like you do with charts and pivot tables.
- Touch-optimized visualization:
- We have a new App which lets you do advanced analysis and visualize your data as a wide range of charts, including bar, column, line, pie, area. You can load any predefined chart and create new charts which later can be saved as favorites. The app is web-based and therefore completely integrated with the charts you create in the current visualizer module on the web. Try it out on your smartphone or tablet by pointing it to the demo and select "smartphone" as the log in option, or directly on the web.
- Integrated Apps:
- Apps are now completely integrated in the menu system, both in "services" menu and in the system overview page, and are now first-class components in DHIS 2. On the demo you can check it out by looking for "Mobile visualizer". Apps are light-weight web applications which can be uploaded through the user interface in the "App management" module under "maintenance". Read more about the app concept and apps in DHIS 2. You can download the app from appstore.dhis2.org.
- Flexible org unit selection:
- The analysis tools - GIS, visualizer (charts) and pivot table - now feature more flexible selection of organisation units through three modes. Select the mode by clicking the gear icon under "organisation units". You can select organisation units by levels, for instance you easily select all facilities in a province by first selecting the province from the tree, then the facility level in the level drop-down. You can select organisation units by groups, for instance you can select a province and then all public facilities inside it.
- Surveillance and alerts:
- DHIS 2 now lets you monitor data, look for outbreaks and send alerts to users for notifiable conditions like measles, cholera and yellow fever outbreaks. With surveillance rules, you can compare current data on the left side with previous data on the right side. You can define a "sequential sample count" implying the number of preceding values to compare with. You can also define an "annual sample count" meaning the number of years to compare for the same period as the current. Alerts will be delivered as DHIS messages, which can be configured to be forwarded to email and SMS.
- Integrated visualizations:
- We have integrated and harmonized the GIS (map), visualizer (chart) and pivot table modules to make them appear as one. You can now move seamlessly between table, chart and map visualizations of data. For instance, you can load a pivot table, then click on a cell and click to render the table as a chart. You can also click in the top-right corner to visualize the whole table as a map or chart. Check it out by loading this pivot table, then visualize as chart or map. You can also go back to the previous table / chart / map from the top-right menu.
- Better GIS:
- GIS now supports reporting rates for data sets, meaning you can now visualize reporting rates on maps. In the thematic layers, select "data sets" under value type. Also, GIS supports relative periods - you can now create maps which updates itself over time, for instance for "last month" or "last quarter". Select "relative" under "period type".
- Better pivot tables:
- Pivot table now lets you include the organisation unit hierarchy inside the pivot. You can select "show hierarchy" under "options" to include it. Pivot table also supports legend sets for improved visualization. You can select a pre-defined legend set under "options". In addition, "data details" are now supported, meaning selection of individual category option combos for data elements. Under "data elements", select "details" and then your desired items.
- Faster event reports:
- Tabular report, used for analysis of event data, is much improved. It is now built on top of a new analytics Web API resource for event data, making it really fast and scalable for large databases. You can use it for querying events and producing aggregate data reports. You can select date ranges, relative periods, organisation units, attributes, identifiers and data elements as report dimensions and filters.
- Flexible locales:
- You can now specify any locale for database translations. Database translations now also works with fallback. This is convenient for instance in a global setup, where you can provide a complete translation for Spanish, then provide a specific translation for Mexican Spanish, where you only translate the elements which are specific to Mexican - the system will fall back to Spanish when Mexican Spanish translations do not exist.
- Improved image maps:
- The image (PNG) maps now support pre-defined legend sets, data set reporting rates and multiple map layers in the same map. It can be accessed under /api/maps in the Web API and easily embedded in your app. Interpretations now use embedded maps, check it out here.
What is new in version 2.11:
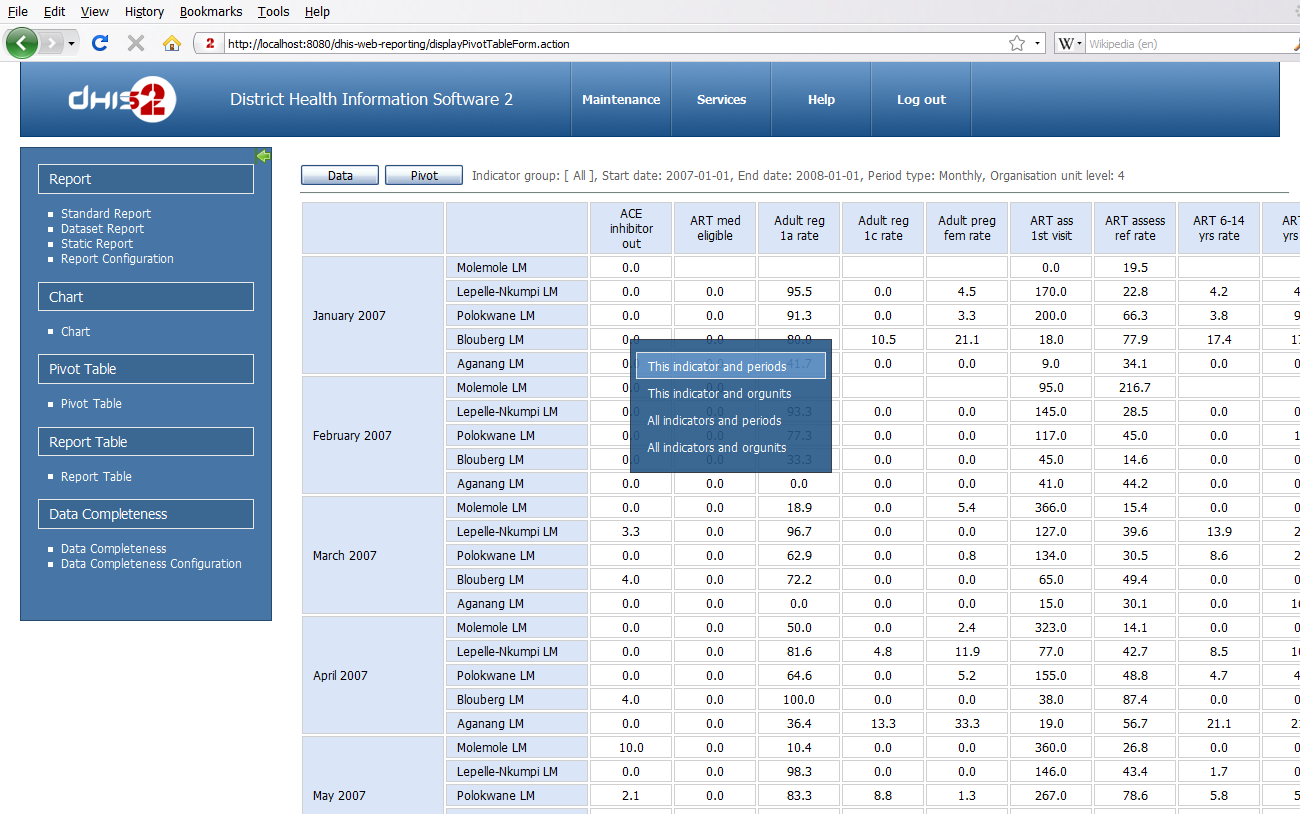
- Web-based pivot table: Allows you to create pivot tables with data aggregated along all data dimensions, including data element/organisation unit group sets. Data dimensions can be arranged freely on columns, rows and as filters. You can include totals and subtotals on all axis and control the table density and font size under options. Your pivots can be saved as favorites and downloaded to your local computer. This design goal is to allow users to create their own reports with the data they need without any involvement of super-users.
- Data analytics Web-API resource: A flexible API for retrieving aggregated, analytical data for all data dimensions using a simple query syntax. The pivot table module is built on top of this API. It allows developers of third-party apps and web portals to connect to DHIS 2 and query for any type of aggregated data, where any number of dimensions and filters can be specified. Data can be retrieved in json, jsonp, xml, csv, html and xls (Excel) format and responses can be constrained with criteria like greater than, equals and so on.
- Sharing: Several objects including chart, pivot table, map, indicator and data set can now be shared and have fine-grained access control. An object can be made private to yourself, shared with any number of user groups or be made available for all. You can grant edit or view-only rights to other people. You can create user groups directly from the dashboard. Who should be allowed to create public objects can be controlled through user roles.
- DXF 2 meta-data exchange: You can now import and export a complete set of objects in the aggregate part of the system, including data sets, custom data entry forms, maps, charts and option sets. Import/export of meta-data objects now uses the new DXF 2 format. Import/export can also be done through the meta-data Web API resource. This greatly improves the ability for meta-data exchange between DHIS 2 instances and third-party systems.
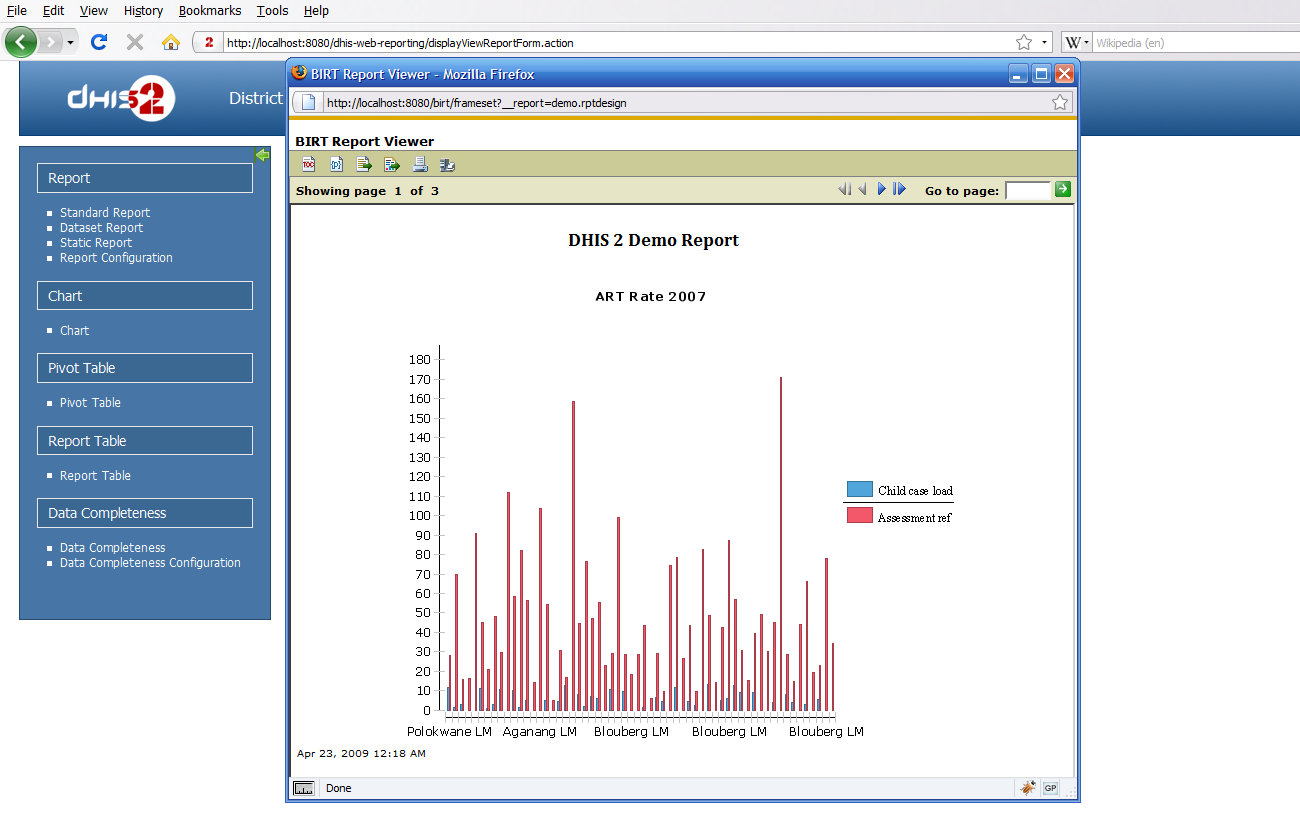
- HTML-based standard reports: You can now develop standard reports in pure HTML and Javascript. This requires a little bit of development skills but allows for creating pixel-perfect reports tailored to most needs. It is especially flexible when used in combination with the analytics Web API, where aggregated data can be pulled out of the system and positioned in the report according to your needs.
- Multi-organisation unit data entry: You can now do data entry for multiple organisation unit in the same form. This is useful for instance in scenarios where you have section forms with few data elements and an organisational hierarchy with hospitals with multiple wards below, as it allows you to do fast data entry for all wards at the same time. To enable it, go the system general settings and enable "multi-organisation unit forms", then go to data entry and select the organisation unit above the ones you want to enter data for.
- Tracker ad-hoc aggregate reports: You can now do on-the-fly aggregation of tracker data in tabular reports. Define aggregation queries with filters or group statements and view the results instantly. Create reports like top 10 diagnoses from inpatient admissions, save as favorite and run the report again whenever you like.
- Tracker program statistics reports: Tracker now comes with better out of the box statistics to program managers. Monitor new enrollments, programs completed, and drop-outs. Also analyse in detail from each stage how many visits are done, completed and overdue.
- Tracker general improvements: The tracker module is rapidly being improved and the user experience is improved in person dashboard, case-based tabular reports, person aggregation and program maintenance.
- Facility registry Web API resource: DHIS 2 now implements the API specification made by the FRED project. This means that DHIS 2 can be considered a feasible facility registry.
- Model changes: Indicator formulas, validation rule formulas and custom data entry forms are now using UIDs (stable identifiers) which makes it possible to transfer these easily between systems. Category options can now be re-used within many categories which improves analysis and naming conventions.
- Miscellaneous: Report table supports weekly periods. Data visualizer has an improved favorite user interface, making it consistent with pivot table and GIS. Touch-friendly navigation for help and profile items (click on help or profile in top menu).
- The scheduling functionality has been improved. As a consequence you must re-set your scheduled jobs after upgrading in data administration -> scheduling.
What is new in version 2.10:
- We have included elements from social networking: You can self-register a user account, create your own profile, post messages and share interpretations. You can easily search and find other peoples profiles and communicate through messages.
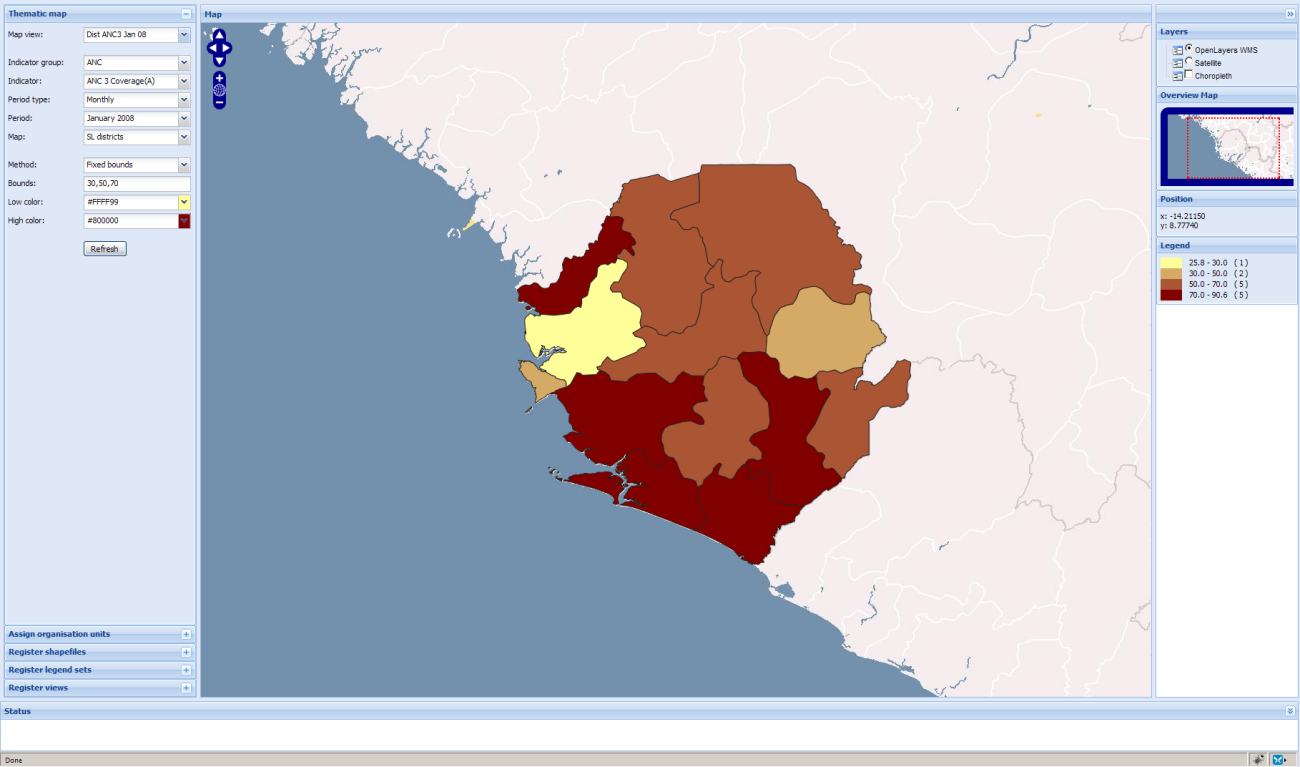
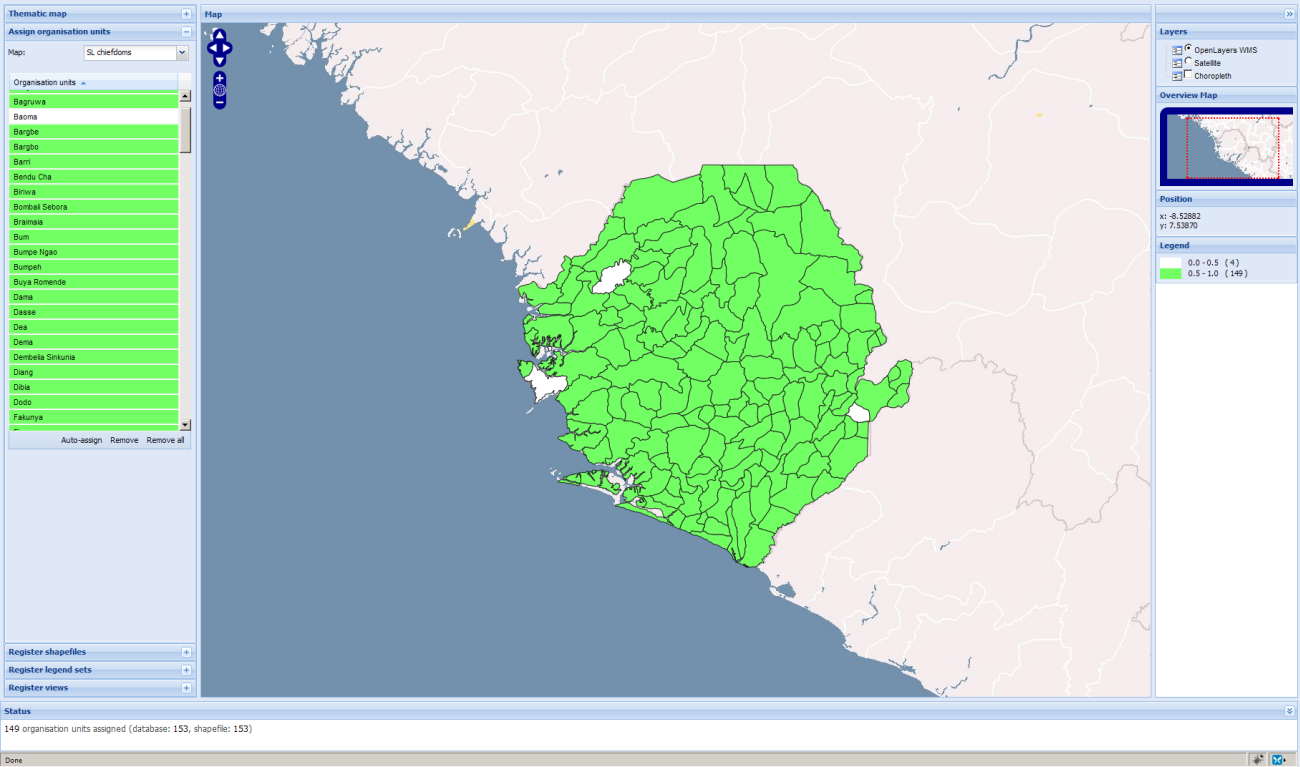
- A completely new GIS module, rewritten from scratch, which comes with much faster load time, more intuitive user interface and more features.
- A brand new web-based mobile client with offline support for smartphones. It lets you enter data, send messages and manage your profile.
What is new in version 2.8:
- Data visualizer plugin: Plugin for embedding the dynamic charts you see in Data Visualizer module directly in Web pages. Data is loaded from the DHIS back-end server.
What is new in version 2.4:
- Offline data entry: The data entry module - if opened when online - is operational even without Internet connectivity. Data can be entered and stored locally while being offline and uploaded to the central server when online. This means that the online deployment strategy will be more viable in areas with unstable Internet connectivity. The total bandwidth usage is greatly reduced since forms no longer are retrieved from the server for each rendering.
- New Symbol layer in GIS: Data can be visualized as symbols rather than colors. The menu system has been improved to allow more space for the map itself and to emphasize the opportunity to load maps into separate layers to produce more advanced map views.
- Improved data mart performance: Now scalable on the number of CPU cores providing a near-linear performance boosts as new cores are added - for instance the processing time for our benchmark database on a quad-core processor was reduced to close to 1/4.
- Modal dialogs: All popups in the system have been replaced by modal dialogs - this has proved to be less confusing to inexperienced users.
- Conversations: The messaging system is now organized around conversations, making it easy to see the full history of an interaction between a super-user and an end-user for instance.
What is new in version 2.3:
- GIS: Relocate facilities on the map. Click on a facility, select "relocate" and move it to its correct position. In combination with the Google Hybrid Satellite map this is a viable alternative to GPS-based positioning of facilities.
- GIS: New symbol layer. Visualize location and distribution of facilities based on its type - each type can be assigned an icon.
- GIS: View "information sheet" for facilities, containing organisation unit attributes and values for a configurable group of "infrastructural" data elements.
- http://apps.dhis2.org/demo/dhis-web-mapping/mapping/index.html
- General performance improvements: Most database operations in the systems are now cached with both improves speed of navigation and moves load from the database into memory - which is easier to scale when required. Most lists in the system are either paged or loaded asynchronously which improves the perceived performance and usability - you can start working on the forms without waiting for long lists to load completely. Data mart processing time down 65 %.
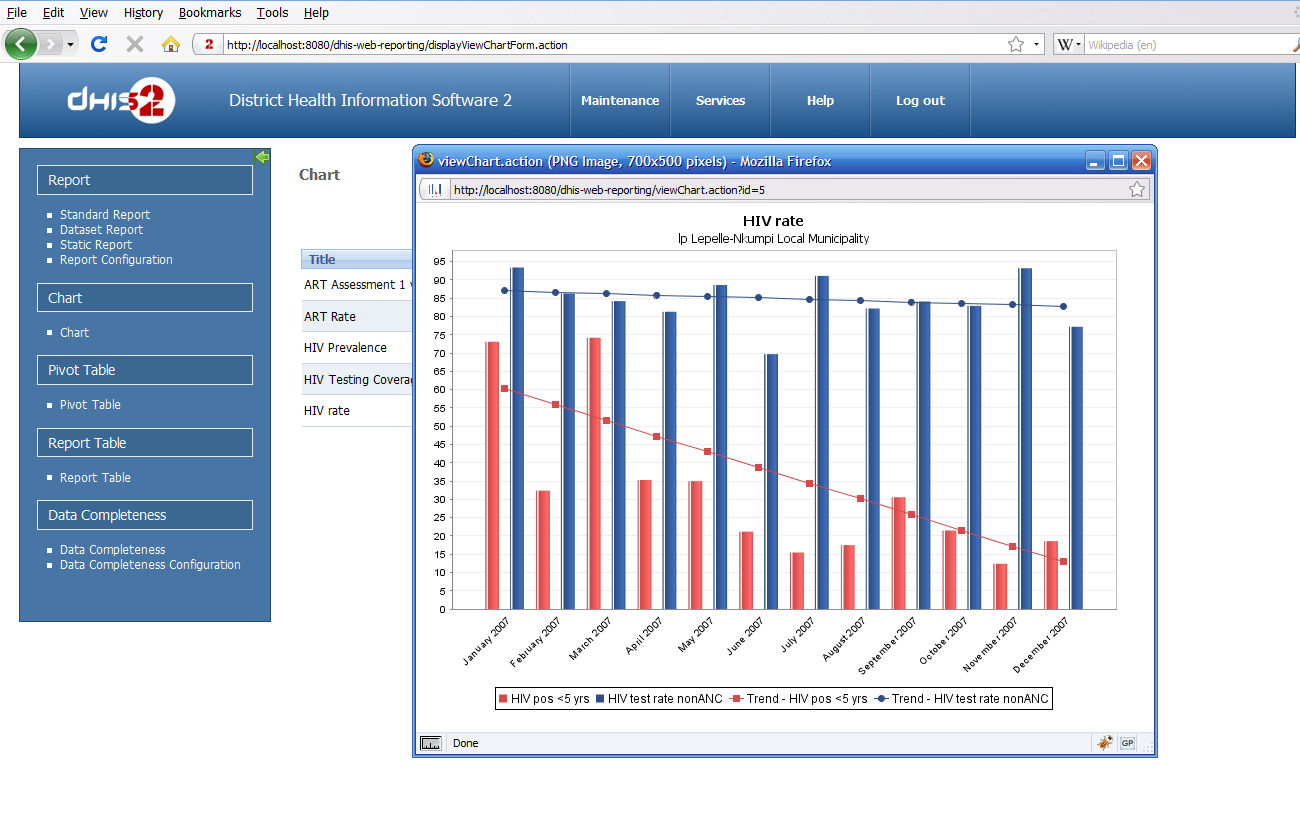
- Charts: Data elements can be used in charts. You can also choose between indicators, periods, and organisation units in charts. Charts can have target line.
- http://apps.dhis2.org/demo/dhis-web-reporting/displayViewChartForm.action
- Data set report: Export to PDF and Excel
- http://apps.dhis2.org/demo/dhis-web-reporting/showDataSetReportForm.action
- Provision for "number of days" for aggregation period in indicator formulas: Useful e.g. for bed occupancy rate indicators.
- Indicators in custom data entry forms: Used for displaying on-the-fly calculations, useful e.g. for stock forms / reports. See (contrived) "EPI Stock" form.
- http://apps.dhis2.org/demo/dhis-web-dataentry/displayForm.action
- User can only create new users with less authority than themselves, useful for decentralization of user management.
- Feedback function where messages are sent from any user to a configurable group of users.
- Full support (except map export to image) for Internet Explorer 9.
- For the technically interested: Hibernate upgraded to 1.6, Jquery upgraded to 1.6.1, CKEditor 3.5, CalculatedDataElement and Source object removed, minimalistic skin, Google API skin no longer required.
- We now have a fresh new 74-page implementation guide, download here:
- http://dhis2.org/documentation
- The MyDatamart tool now includes function for generation of Excel pivot tables connected to the local data mart.
What is new in version 2.1:
- Report generation is now really fast and works well in multi-user environments.
- GIS can have system and user map views - ie users can create their own views without seeing each others while still being able to see the views the super-users have put in.
- GIS has option for going back in the map view history.
- Reports can have completeness data.
- Financial period types based on April, July and October.
What is new in version 2.0.4:
- Improved validation with standard deviation, minmax, gap and followup analysis.
- Dimensional report tables.
- Improved GIS with predefined legend sets, export to png and excel workbook, and labels.
- Client side / on-the-fly validation of forms.
- Data archiving.
- Embedded help.
- Merging of organisation units and elimination of data element duplicates.
- Objective dataset completeness reporting.
- Support for Chrome, Opera, IE8.
What is new in version 2.0.3:
- The DHIS 2 Live package has been improved and now contains GIS, reporting, charting ++ as well as an embedded servlet container, database and sample data in just 60 MB.
- A live demo of the release can be found at demo.dhis2.org
Comments not found