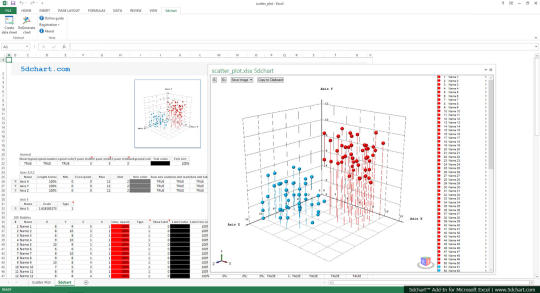
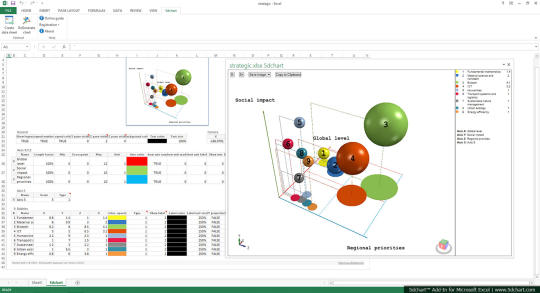
Create stunning 3D bubble charts in Excel with 5dchart Add-In. 5dchart Add-In for Microsoft Excel is an easy-to-use tool for multi-dimensional data visualization. It allows you to display a 3D bubble chart with two additional parameters: 3D coordinates of each bubble and bubble size and colour. Of course, it is the easy way to create 3D scatter plot too. 5dchart Add-In is designed to allow 3D charts drawing directly in Microsoft Excel without using any standalone applications. We believe it's one of the most sophisticated 3D bubble chart drawing tools for Microsoft Excel.
What is new in this release:
Version 2.5:
- Fixed an issue preventing chart from displaying on some systems
- Now it's easier to hide individual bubbles
- Minor bug fixes and stability improvements
What is new in version 2.4:
Version 2.4: Added support for Windows 10 and Microsoft Office 2016; Dropped support for old frameworks: .NET 4.5 is now required.
What is new in version 2.2:
Version 2.2 includes minor improvements.
What is new in version 2.1:
Version 2.1 includes bug fixes and improvements.
Requirements:
MS Excel 2010 or later, .NET Framework 4.0, Visual Studio 2010 Tools for Office Runtime
Limitations:
Watermarks, disabled high resolution

Comments not found